- THE ECB BLOG
More digital, more productive? Evidence from European firms
21 June 2023
Digitalisation has boosted some European firms’ productivity, but many are still on the digital sidelines. That is a pity as faster digital adoption could make our economies much more productive. This ECB Blog post looks at where and how digitalisation can be a gamechanger.
Digitalisation promised to be a productivity gamechanger, yet we are still facing a “productivity paradox” at the aggregate level. For decades, rapid advances in digitalisation have coincided with a protracted slowdown in aggregate productivity growth.[1] But studies based on micro firm-level data have repeatedly found that digitalisation does improve the productivity of individual firms.[2] Digitalisation might be like other general-purpose technologies in that it could take a while to deliver its potential productivity gains. If adopted successfully it could become a gamechanger, because of the faster and much more wide-ranging use of digital technologies during the COVID-19 pandemic.[3] European policymakers have also made the issue a priority with policies like the EU’s Digital Single Market and Next Generation EU initiative.
We took a closer look at the role of digitalisation in firm-level productivity growth over the past couple of decades.[4] To do this we examined total factor productivity (TFP) at the firm level. TFP is basically the growth in output (production and services) that can’t be explained by the growth in input (labour and capital). It shows how much more productive the existing inputs are. We used data for firms operating in Europe between 2000 and 2019, including 19.3 million firm-level observations containing information from nearly 2.4 million firms.[5]
At first glance, firms in the digital sector are considerably more productive than those in the non-digital sector.[6] The digital sector consists of companies that rely more than others on information and communication technology. This means, for example, that they use more robots, have a higher share of online sales or invest more in computers and software.
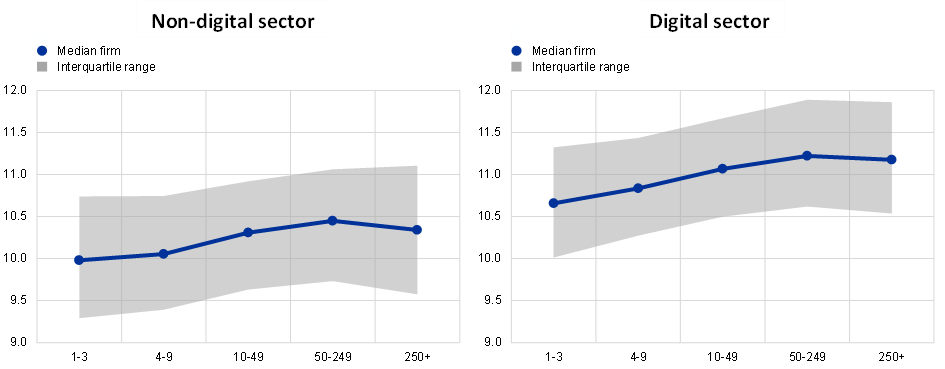
Chart 1 displays the interquartile range and the median firm’s TFP level by employment size – in both digital and non-digital sectors. It reveals some interesting facts. First, larger firms are more productive than smaller firms, especially in digital sectors.[7] Second, firms in the digital sector are in general more productive than firms in the non-digital sector regardless of how big they are.
Chart 1
Interquartile range and median firm’s TFP by employment size in digital and non-digital sectors
y axis: total factor productivity, in logarithms; x axis: number of employees

Source: Bureau van Dijk’s Orbis and Anderton et al. (2023)
Notes: Digital and non-digital sectors are defined following Calvino et al. (2018). Digital sectors are those with a high digital intensity in 2013-15
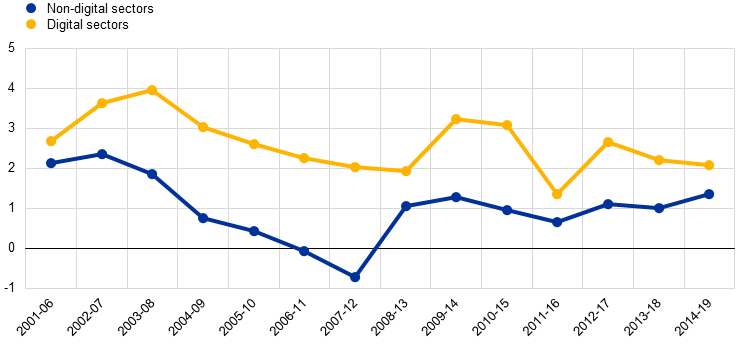
Moreover, firms in the digital sector seem to improve their productivity faster than firms in the non-digital sector. Chart 2 shows the average yearly TFP growth for European firms in the digital and non-digital sectors over five-year periods. It shows that firms in the digital sector consistently have stronger average TFP growth than firms in the non-digital sector. Firms in both sectors were hit by the global financial crisis and by the European sovereign debt crisis. However, while the average TFP growth for firms in the digital sector went down from around 4% per year during the 2003-08 period to 2% per year in 2007-12, firms in the non-digital sector fared worse, with average TFP growth falling from 2% to -0.6% over the same period. It therefore seems that firms in the digital sector were significantly more insulated from the effects of the crises, at least in terms of their productivity dynamics.
Chart 2
Average yearly TFP growth for European firms in digital and non-digital sectors
Percentages

Sources: Bureau van Dijk’s Orbis, and Anderton et al. (2023).
Notes: Average TFP growth rates are weighted by the firms’ employment levels at year t−5 and presented in yearly growth rates.
So, is digitalisation a massive gamechanger? Digital technologies promise large productivity gains through improved production process efficiency and higher rates of automation and robotisation. At first glance, this could have been an explanation for the stronger productivity performance of firms in the digital sector. However, we found that the differences in productivity for the aggregated results above were not primarily due to digitalisation itself but were instead driven by the different characteristics of firms and productivity dynamics in the digital and non-digital sectors. This suggests that digital technologies might not yet be fully operationalised, delaying a new wave of productivity growth.
We use a proxy to identify the impacts of digitalisation, specifically the intensity of digital investment at the country and sector level over time. This is calculated as the ratio between the real investment in digital technologies and the real total investment.[8]
There are additional factors besides digitalisation that could drive TFP in firms: (i) possible catch-up effects of low-productivity firms that need to become more productive over time to survive; (ii) the technological diffusion and adoption of best practices from the most productive firms (i.e. frontier firms) to the remaining ones (i.e. laggard firms); (iii) different firm characteristics such as employment size, age, and financial health; and (iv) the degree of market concentration.[9]
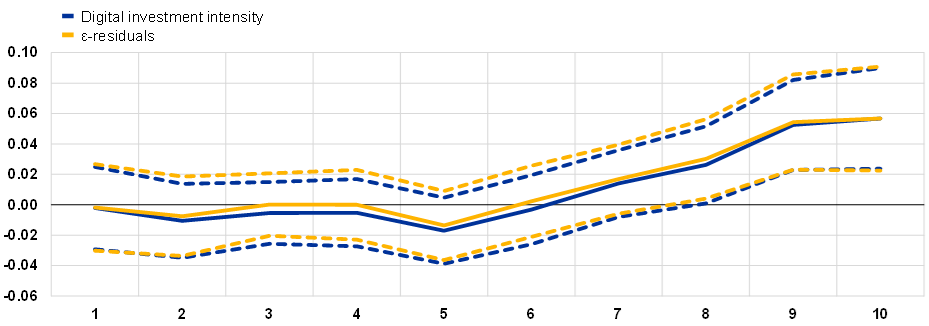
Our analysis confirms that, on average, European firms that invest more in digital technologies will increase their productivity faster. However, we found that a 1% increase in digital investment intensity is only associated with a very modest 0.02 percentage point increase in TFP growth. This suggests that most of the productivity growth gains by firms in the digital sector is driven by other channels. Importantly, not all firms experience the same productivity returns on digital investment. Chart 3 shows the estimated impact of a 1% higher digital investment intensity on the average firm’s TFP growth by its proximity to the productivity frontier (the distance to the group of best-performing companies).[10] It reveals that digitalisation primarily boosts productivity for firms which are already more productive than their peers, while laggard firms are less able to reap the potential productivity gains from digitalisation.[11]
Chart 3
The impact of a 1 percentage point increase in digital investment intensity on firms’ TFP growth by proximity to the productivity frontier
y axis: percentage points; x axis: deciles (1 = lowest, 10 = highest)

Sources: Bureau van Dijk’s Orbis, Eurostat, OECD, and Anderton et al. (2023).
Notes: Dashed lines correspond to the 95% confidence interval.
The results from our analysis suggest that digitalisation can be a productivity gamechanger for some firms, but that it is more of a sideshow for most firms. Bearing that in mind, policymakers should not see digitalisation as a “one-size-fits-all” strategy to boost productivity. Instead, policies that provide incentives to invest and adopt digital technologies are more likely to be successful if targeted towards relatively productive firms and specific innovations that use digital technologies to improve the potential output of the economy. These results are addressed towards the potential impact of digitalisation on firm-level productivity. However, they do not try to assess the benefits of digitalisation from the consumer perspective. For example, if all firms in a given sector become increasingly digital, our results tell us that this investment is likely to benefit the more productive firms in the sector relatively more than their less productive competitors. However, all customers are bound to benefit considerably from this investment, independently of the productivity of the firm they buy from.
The views expressed in each article are those of the authors and do not necessarily represent the views of the European Central Bank and the Eurosystem.
Subscribe to the ECB blogWe follow Anderton, R. and Cette, G. (2021), “Digitalisation: channels, impacts and implications for monetary policy in the euro area”, ECB Occasional Paper No 266, and define digitalisation in its broad sense. This includes, among other things, a wide range of information and communication technologies, technologies enabling automation and robotisation, and technologies related to the processing and analysis of digital data (including artificial intelligence, machine learning, and quantum computing).
For recent examples see Gal, P., Nicoletti, G., Renault, T., Sorbe, S., and Timiliotis, C. (2019), “Digitalisation and productivity: In search of the holy grail – firm-level empirical evidence from EU countries”, OECD Working Paper No 1533, and Cusolito, A.-P., Lederman, D., and Peña, J. (2020), “The effects of digital technology adoption on productivity and factor demand: firm-level evidence from developing countries”, World Bank Policy Research Working Paper No 9333.
Amankwah-Amoah, J., Khan, Z., Wood, G., and Knight, G. (2021), “COVID-19 and digitalization: The great acceleration”, Journal of Business Research, Vol. 136.
See Anderton, R., Botelho, V., and Reimers, P. (2023), “Digitalisation and productivity: gamechanger or sideshow?”, ECB Working Paper No 2794.
The data is taken from Bureau van Dijk’s Orbis. The set of countries included in the analysis comprises Austria, Belgium, Estonia, Finland, France, Germany, Italy, Latvia, Norway, Portugal, Slovenia, Spain, and Sweden.
Digital and non-digital sectors are defined following Calvino, F., Criscuolo, C., Marcolin, L., and Squicciarini, M. (2018), “A taxonomy of digital intensive sectors”, OECD Science, Technology and Industry Working Paper No 14. For simplicity, we refer to the set of firms in digital-intensive sectors as the Digital sector and to the set of firms in non-digital-intensive sectors as the Non-digital sector. Mapping this taxonomy to the NACE Rev. 2 sectors, the digital sector comprises: (i) the manufacture of motor vehicles and other transport equipment; (ii) telecommunications; (iii) computer programming and consultancy; (iv) information services; (v) financial services; (vi) professional, scientific and technical activities; (vii) administrative and support services; and (vii) other services.
The median large firm with more than 250 employees is 39% more productive than the median micro firm with less than 9 employees in the non-digital sector; and the median large firm is instead 55% more productive than the median micro firm in the digital sector.
The investment in digital technologies broadly comprises the investment in information and communication technologies and intellectual property products, which encompass the investment in computer software and databases and also expenditures on research and development. Anderton et al. (2023) also account for the fact that digital investment intensities might have increased driven by the long-term decline in the price of digital technologies. They cater for this channel by considering a second measure of digitalisation measuring the extent to which the digital investment intensity exceeds, or falls short of, what would be expected from declines in the relative price of digital investment. This measure is denoted as ε-residuals.
We account also for other common factors via country-sector fixed effects and the business cycles with year fixed effects.
The proximity to the frontier is measured at the country-sector-year level. That is, for each year and in a given country and sector, firms are sorted according to their productivity levels. The 5% most productive firms are the productivity frontier. We then compute for all the other firms in the same country, sector, and year, the distance between their TFP level and the average TFP level of these frontier firms. We group these firms by deciles and show the estimated impact of digitalisation on the firms’ TFP growth by decile.
It should be noted that for many firms an increasing digital investment is associated with negative productivity returns in the short run. This happens either because firms are not targeting their investments towards productivity-enhancing activities, or because they are not able to fully reap the benefits of digital innovations to become more productive overall.


