Housing costs: survey-based perceptions and signals from price statistics
Published as part of the ECB Economic Bulletin, Issue 1/2022.
A recurring theme in the “ECB Listens” event conducted in the context of the monetary policy strategy review was the affordability of housing and the case for including more adequately the related costs in the HICP.[1] More than 80% of all respondents considered the increase in the cost of housing relevant for inflation measurement. This was addressed in the strategy review by suggesting the inclusion of owner-occupied housing (OOH) costs in inflation measurement on the basis of the net acquisition approach.[2]
However, perceptions of housing costs can be analysed on the basis of different sources of data. This box reviews perceptions of housing costs among tenants and homeowners based on survey microdata, compares them with developments in housing costs based on macro price statistics and illustrates conceptual differences between various measures that are important in the interpretation of the data.
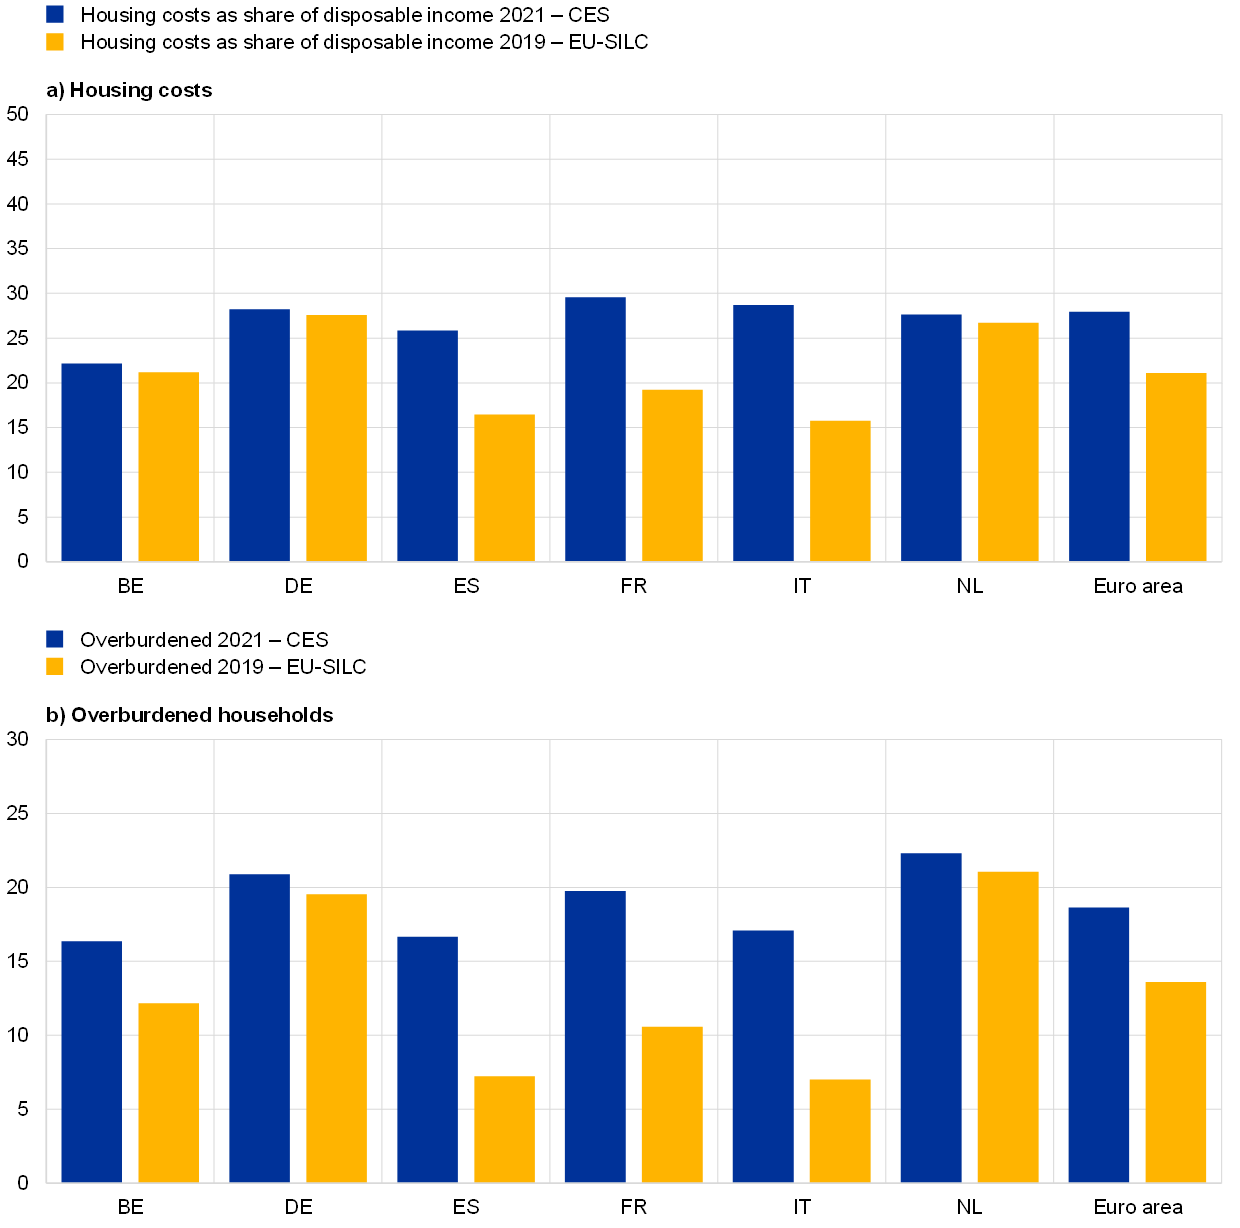
Consumer surveys are a prime source of perceptions of housing costs in euro area countries. Panel a of Chart A shows the ratio of housing-related costs to disposable income based on European Union Statistics on Income and Living Conditions (EU-SILC) for 2019 (the latest year for which data are available)[3] and the ECB’s Consumer Expectations Survey (CES), for which more timely data are available (latest data: October 2021). The difference between the two surveys is partly related to definitions, a degree of measurement uncertainty and, more importantly, developments during the coronavirus (COVID-19) pandemic (which are not reflected in EU-SILC because of the date of the survey).
Chart A
Ratio of self-reported housing costs to income and share of households overburdened by housing costs in selected euro area countries
(percentage shares)

Sources: Eurostat, ECB and ECB staff calculations.
Notes: Data from the CES refer to October 2021, while data from EU-SILC are based on the 2020 release. The EU-SILC and CES measures are based on the respective microdata. The overburdening measure is also based on the microdata and reflects the ratio of reported housing costs to household disposable income. The share of overburdened households is the percentage of households with housing costs exceeding 40% of disposable income.
Both surveys indicate that housing costs are the largest item in household spending and that housing is indeed perceived by many households as challenging to afford. According to EU-SILC data, housing costs in the euro area were, on average, 21% of disposable income in 2019, with considerable heterogeneity across countries. Among the largest euro area countries, the ratio of housing costs to disposable income was substantially above the euro area average in Germany and the Netherlands, but substantially below the average in Italy and Spain. Data from the CES for October 2021 point to a higher average ratio of housing costs to disposable income in the euro area (based on data for Germany, France, Italy, Spain, the Netherlands and Belgium) and less heterogeneity across large euro area countries.[4] Based on EU-SILC data for 2019, around 14% of households in the euro area are overburdened by housing costs (i.e. their housing costs are in excess of 40% of their disposable income), again with considerable heterogeneity across large euro area countries. CES data for October 2021 show a higher share of overburdened households on average in the euro area (19%) and, again, less heterogeneity across large euro area countries.
There are important conceptual differences between the types of housing costs included in perceptions and price statistics. As explained in the article entitled “Owner-occupied housing and inflation measurement” in this issue of the Economic Bulletin, there are several ways in which the related price developments can be measured. Some approaches (e.g. net acquisition) rely directly on the cost of acquiring a dwelling, which is closely related to house prices. Other approaches (payments, user cost, rental equivalence) rely on the ongoing cost of using owner-occupied housing or its shadow price. In practice, the resulting measures diverge significantly. Owner-occupied housing price indices (OOHPIs) follow the net acquisition approach. By contrast, total housing costs in EU-SILC follow a quasi-payment approach and include mortgage interest payments (for homeowners), rents (for tenants), and costs of utilities, insurance, services and charges, taxes, maintenance and repairs, but exclude acquisition costs (for homeowners). Table A divides housing costs into three categories (costs only affecting tenants, costs only affecting homeowners and costs affecting both). Housing costs for tenants included in EU-SILC can be matched relatively closely to those included in the HICP (Table A). For homeowners there is conceptually only a loose link to macro statistics as reflected in OOHPIs. Most importantly, mortgage interest payments are included in the EU-SILC measure of OOH costs, but not in the OOHPI, while other services related to the acquisition of dwellings, self-build dwellings and major renovations, and purchases of new dwellings are important categories in the OOHPI (with a total weight of 77% in the index), but are not included in EU-SILC. Hence, the overlap between homeowner costs included in EU-SILC and the OOHPI’s net acquisition approach is quite limited. This complicates any comparison and limits the usefulness of EU-SILC data for assessing homeowners’ housing costs.[5]
Table A
Housing cost for tenants and homeowners and their coverage in OOHPIs, HICP sub-aggregates and EU-SILC

Source: Eurostat.
Notes: EU-SILC total housing costs are available as an aggregate only; no data or weights for individual components are available. For OOHPI and HICP sub-components, contributions to the total index (weights) are indicated in brackets.
1) For a detailed explanation of the components of OOHPIs and what would be included in the HICP under the net acquisition approach, see the article entitled “Owner-occupied housing and inflation measurement” in this issue of the Economic Bulletin.
Over the last decade, the growth rate of self-assessed housing costs of tenants in the euro area, based on EU-SILC data, has been similar to the growth rate for rents in the HICP. According to EU-SILC, aggregate self-assessed housing costs grew at around 2% for most of the sample period (Chart B, panel a). Except for the last three years, these increases have been somewhat less strong than those of the matched components of HICP housing costs for tenants, while better mirroring the dynamics of HICP rents. This discrepancy may be due to EU-SILC participants being less aware of the costs of utilities, insurance, services and charges, taxes, maintenance and repairs than the cost of rents.
Chart B
Growth in self-reported housing costs for tenants compared to selected components of the HICP, and for homeowners compared to selected components of the OOHPI and the mortgage lending rate
(annual percentage changes)

Sources: Eurostat and ECB staff calculations.
Notes: Euro area aggregates. For details of the series included, see Table A. We exploit a two-stage approach to obtain the growth rates of total housing costs by ownership, country and year. First, household-level information on total housing costs is aggregated using EU-SILC household weights at the country level. To get the growth rate for the euro area, we then weight each country-year specific growth rate by the size of the respective housing market (price-updated expenditure on owner-occupied housing). This implies that the derived growth rates for housing costs could also include the effects of, for example, an improvement in the average housing quality. The mortgage lending rate is “Cost of borrowing for households for house purchase – euro area, annualised agreed rate”.
Conversely, the pattern of home-ownership costs based on EU-SILC data has been diverging strongly from price developments reflected in the OOHPI. While OOHPI inflation exhibited steady increases over time to levels clearly above 2% from 2015 to 2019, self-reported OOH costs based on EU-SILC have been much more volatile and have, on average, decreased or barely increased each year since 2016 (Chart B, panel b). One likely reason for the difference between the OOHPI and OOH costs based on EU-SILC is that the costs of other services related to the acquisition of dwellings, self-build dwellings and major renovations, and purchases of new dwellings, which account for most of the increase in the OOHPI from 2016 to 2019, are not included in the EU-SILC measure. Moreover, the mortgage interest rate is included in EU-SILC but not in the OOHPI. As mortgage lending rates have declined strongly since 2012, this can help to explain the decreases in the EU-SILC measure of OOH costs.
Focusing only on households which recently bought a dwelling brings housing costs for homeowners in EU-SILC more in line with developments in the OOHPI. For households buying property in recent years, mortgage lending rates have been low, while residential property prices, and hence often also the sizes of mortgages, have increased. These effects can be illustrated by deriving a measure that only reports EU-SILC-based OOH costs in the year that the house was purchased. In this measure, house price developments play a more important role in housing costs, which in turn would be a better approximation of OOHPIs, in which developments in real estate prices play an important role. In contrast to the broader measure of EU-SILC-based OOH costs, this narrower measure, albeit imperfect, seems to be more in line with the developments in the OOHPI (Chart B).
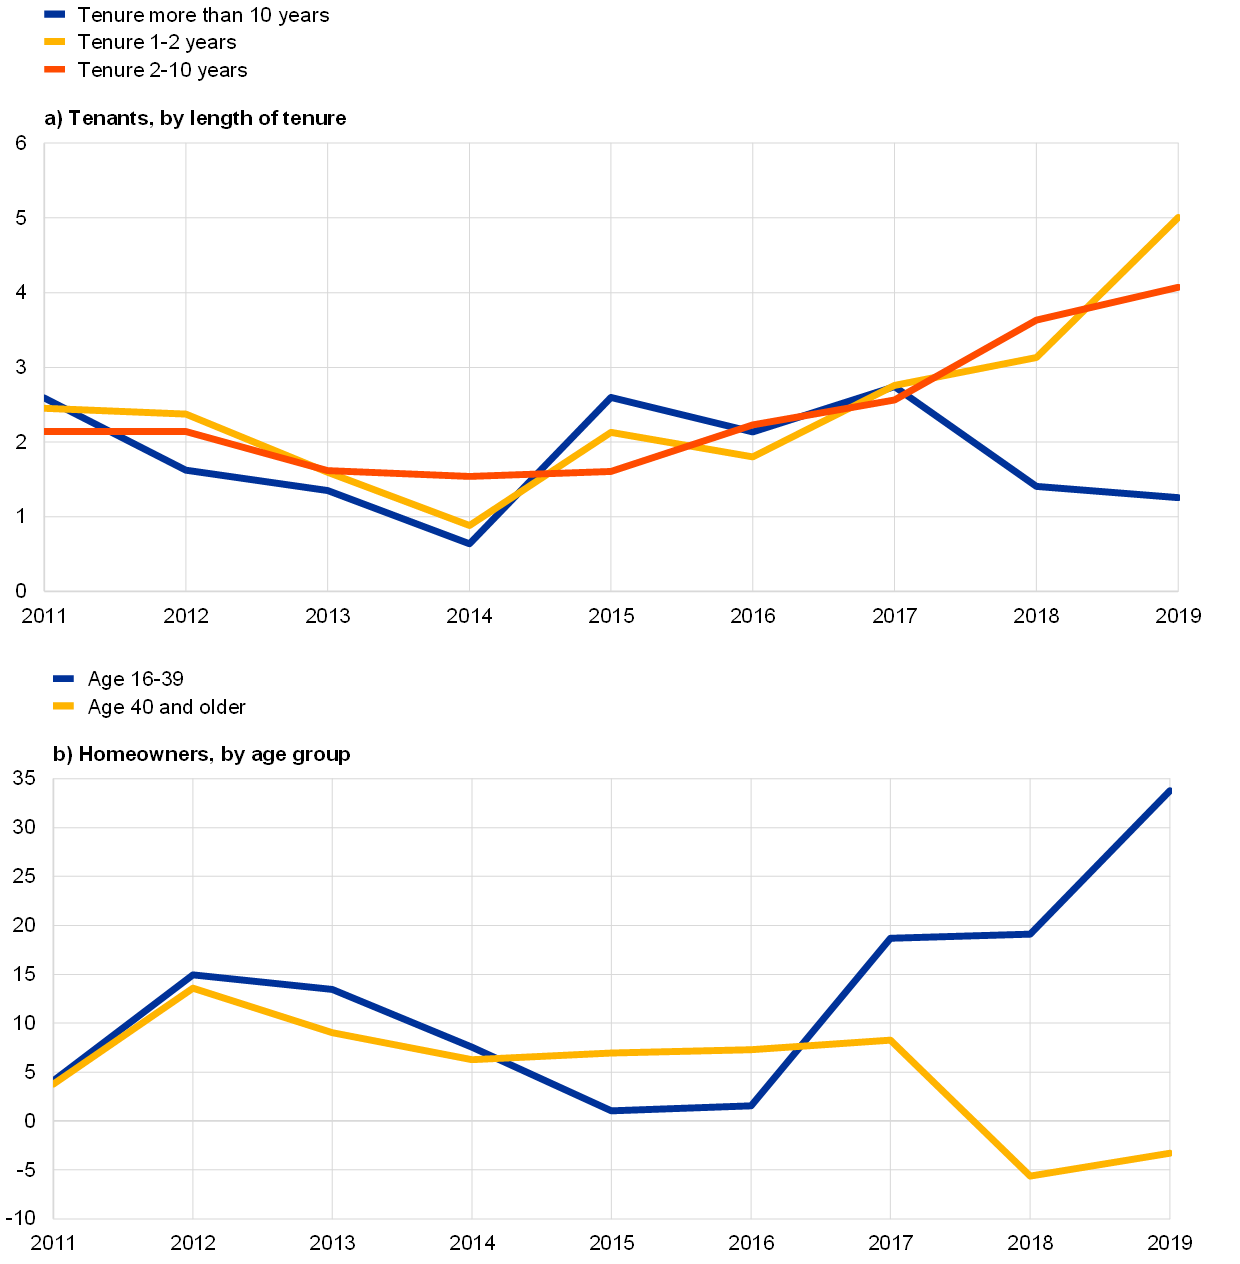
One key advantage of EU-SILC survey data on housing cost perceptions is that developments can be analysed for different groups of tenants and homeowners. The overall increase in housing costs for tenants in 2018 and 2019 was driven mainly by newer rental contracts (with the fastest growth in rents being for contracts with a tenure of less than two years), while rents for contracts more than ten years old fell on average over the same two years (Chart C, panel a). Looking at the ages of buyers, the properties bought by younger households were, on average, harder hit by the price increases. Panel b of Chart C shows the results for two age groups: 16-39 and 40 plus.[6] The difference in the growth rates across the two categories, which is similar to that for rents, has become significant since 2017, reflecting the more dynamic housing market faced by younger people.
Chart C
Growth in self-reported housing costs for tenants, by length of tenure, and for homeowners (acquisition approximation), by age
(annual percentage change)

Source: Eurostat and ECB staff calculations.
Notes: Both measures are based on the total housing costs reported. The growth rates are derived from EU-SILC microdata. To avoid measurement errors introduced by the possible divergence of refence periods, three-year rolling averages are used. In panel b, to approximate the acquisition cost, only homeowners who bought their dwelling in the year of reporting are included. Homeowners older than 70 are excluded.
- See “ECB Listens – Summary report of the ECB Listens Portal”. The survey results were collected between 24 February 2020 and 31 October 2020.
- For more on the outcome of the strategy review and the related price index, see the article entitled “Owner-occupied housing and inflation measurement” in this issue of the Economic Bulletin.
- EU-SILC data for Italy refer to 2018, owing to non-availability of data for 2019.
- As no overlapping data are available for EU-SILC and the CES, it is unclear to what extent the differences between EU-SILC data for 2019 and CES data for October 2021 reflect developments over time or differences between the surveys.
- For more information on the different approaches, see the box entitled “International practices in the treatment of owner-occupied housing in consumer price indices” in the article entitled “Owner-occupied housing and inflation measurement” in this issue of the Economic Bulletin.
- The choice of only two age groups is to assure that there are enough observations in each bin, given the limited sample size. The sample follows the acquisition approximation described in the notes to Chart C, so only respondents who bought a house in the same year are included.


