Recent developments in social security contributions and minimum wages in the euro area
Published as part of the ECB Economic Bulletin, Issue 8/2019.
The behaviour of labour costs can be significantly affected by country-specific changes in social security contributions and minimum wages. An awareness of the nature and magnitude of such factors is important when assessing the strength of wage growth and its implications for producer and consumer price inflation. This box examines how these two factors have affected aggregate euro area wage growth.
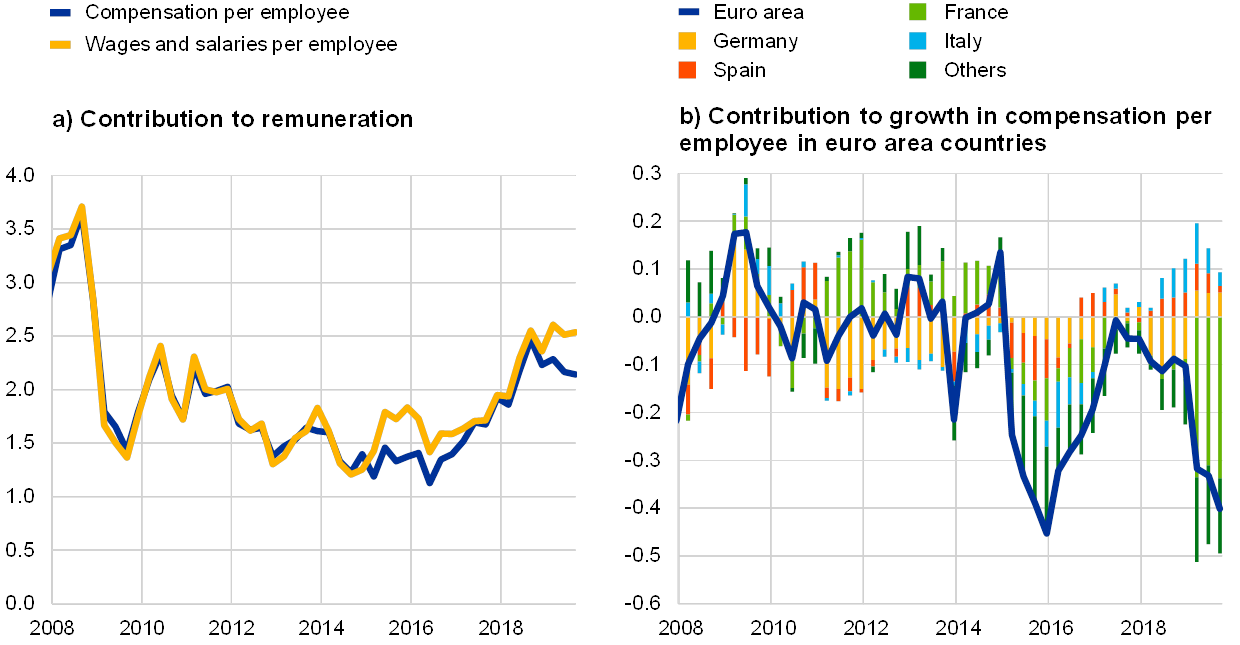
Measures of labour costs, such as compensation per employee[1], can at times be affected by measures related to employers’ social security contributions. If substantial enough, changes in the social security contributions made by employers can drive a wedge between different wage measures (see Chart A, panel a). For example, the gap between the growth in compensation per employee and the growth in wages and salaries per employee in 2015-16 was related to cuts in employers’ social security contributions in each of the four largest euro area countries (see Chart A, panel b).[2] Since the beginning of 2019, a gap has again opened up, which relates mainly to a significant drop in social security contributions in France, while in Germany, Italy and Spain employers’ social security contributions have increased. The reduction in employers’ social security contributions in France was related to a legislative change implying a permanent reduction in employers’ social security contributions, which replaced the tax credit for competitiveness and employment (crédit d’impôt pour la compétitivité et l’emploi – CICE). This legislative change held back growth in compensation per employee in the first three quarters of 2019, with increases of 2.3%, 2.2% and 2.1% in the first, second and third quarters respectively – only slightly above the long-term average of 2.1% since 1999. Annual growth in wages and salaries per employee, which excludes employers’ social security contributions and is not affected by the legislative change in France, hence grew stronger than compensation per employee at a rate of 2.6%, 2.5% and 2.5% in the first, second and third quarters respectively – comfortably above the long-term average of 2.2% since 1999. Overall, growth in wages and salaries per employee is more dynamic at the current juncture than growth in compensation per employee.
Chart A
Employers’ social security contributions and wage growth in the euro area
(panel a: annual percentage changes; panel b: percentage points)

Sources: Eurostat and ECB calculations.
Note: The latest observation is for the third quarter of 2019.
Changes in minimum wages can also significantly affect wage behaviour, as they are governed by indexation or legislation rules rather than wage bargaining processes. Minimum wages exist in 15 of the 19 euro area countries.[3] In July 2019 the minimum wage paid in the euro area ranged from €430 (Latvia) to €2,071 (Luxembourg) per month. Over the last ten years, the minimum wage has increased, on average, by between 1.5% (Ireland) and 7% (Estonia) per year.[4] Minimum wage levels are set using different methods – including predetermined formulas, expert committee recommendations and consultation with social partners – but are often also subject to government discretion. As a result, the frequency of change differs from one country to another. However, most countries usually revise their minimum wages every one to two years.
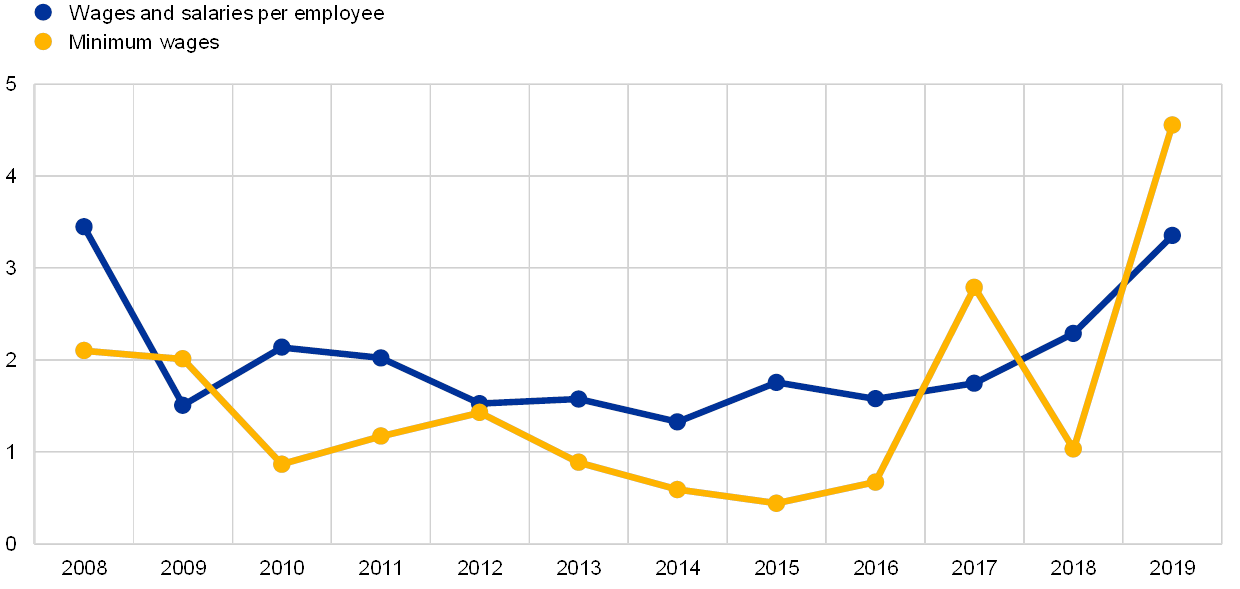
Minimum wage growth has so far been substantially stronger in 2019 than growth in overall wages and salaries per employee. An index for the euro area compiled on the basis of available country data[5] shows that, after only a 1% increase in statutory minimum wages in 2018, minimum wages increased by 4.6% year on year in the first half of 2019 (see Chart B).
Chart B
Growth in wages and salaries per employee, as well as minimum wages, in the euro area
(annual percentage changes; annual data)

Sources: Eurostat and ECB calculations.
Note: The observation for 2019 is based on data for the first three quarters of 2019.
Growth in the level of minimum wages in the first half of 2019 was broad-based across countries.[6] For the first time since 2008, all euro area countries with minimum wages increased the statutory national minimum wage level in 2019, with increases on the previous year ranging from 1.5% (France) to 17.9% (Spain) (see Chart C, panel a).
Chart C
Minimum wage developments and their role in growth in wages and salaries per employee
(panel a: annual percentage changes; panel b: percentage points)

Sources: Eurostat and ECB.
Note: Panel b) is based on estimates (applying calculations based on EU-SILC data) for the size of the group of minimum wage recipients in euro area countries and the euro area aggregate.
The direct mechanical impact of changes in the level of the minimum wage on overall euro area wage growth tends to be small. Calculating such direct contributions requires information on the number of recipients. This box uses data from the EU Statistics on Income and Living Conditions (EU-SILC) to derive a proxy for the share of minimum wage recipients in recipients of overall wages and salaries.[7] Bearing in mind the considerable uncertainty surrounding this proxy, the data for the euro area show that the direct mechanical contribution of minimum wages to growth in wages and salaries per employee has increased in 2019, but has – with a magnitude of around 0.1 percentage points – been quite limited (see Chart C, panel b).
For some countries, the direct mechanical impact of changes in minimum wages on the growth of wages and salaries per employee has likely been more substantial. In the first half of 2019, for example, the estimates based on the proxy suggest that minimum wage growth has contributed up to 0.5 percentage points to national wage growth (see Chart C, panel b). However, such estimates cover only the direct effects of minimum wage changes on wage growth in an accounting sense. Hence they abstract from indirect effects of minimum wages on the wage scale[8], as well as from effects linked to the possible repercussions of changes in minimum wages on employment[9] or to the dynamic interaction of wage-setting and minimum wage adjustments.
Taken together, wage growth has been quite robust recently, especially if developments in social security contributions are taken into account. While growth in compensation per employee has been softening over recent quarters (see Chart A), it reflects mainly lower employers’ social security contributions. Growth in wages and salaries per employee, which exclude employers’ social security contributions, remained quite robust and has also benefited recently from a somewhat higher contribution of minimum wages. Overall this box supports the view that the robustness of wage growth is mainly the result of resilient labour markets, especially when taking into account recent developments in social security contributions and minimum wages.
- Compensation per employee is the total remuneration, in cash or in kind, that is payable by employers to employees in return for work, i.e. gross wages and salaries, as well as bonuses, overtime payments and employers’ social security contributions, divided by the total number of employees.
- It should be noted that social security contributions to wage growth can reflect more than just changes in social security rates.
- The four euro area countries with no statutory minimum wages are Italy, Cyprus, Austria and Finland.
- Source: Eurostat.
- The index is weighted by the number of employees in the respective countries. For countries with no minimum wage, the minimum wage is assumed to be zero. This means that the growth rate of euro area minimum wages in Chart B is weighed down by the inclusion of countries with no minimum wage.
- For each of the 15 euro area countries with a minimum wage, we estimate the national minimum wage by taking an average of the levels on 1 January and 1 July each year.
- First, the share of minimum wage recipients is calculated based on the EU-SILC data. For this we calculate the share of employees with an income within a band of 90% to 110% of the minimum wage. This share is then applied to the total number of employees in the economy to derive the number of recipients of minimum wages in an economy. Multiplying this number by the respective level of the minimum wage in each country gives the amount of wages and salaries that can be assigned to minimum wage recipients and allows for the calculation of the share of this group in overall wages and salaries in each country and – aggregating country results – the euro area. Controlling for differences in hours worked by minimum wage recipients and overall employment does not substantially affect the results. The percentages of employees have been estimated using EU-SILC micro data for every year up until the last observation of 2016. For the rest of the sample the percentages are kept constant, except where country-level administrative data are available to complement the analysis. For details of the EU-SILC micro data, see the discussion in the article entitled “The effects of changes in the composition of employment on euro area wage growth” in this issue of the Economic Bulletin.
- An analysis of such effects for the case of France can be found in Gautier, E., Fougère, D. and Roux, S., “The Impact of the National Minimum Wage on Industry-Level Wage Bargaining in France”, Working Paper Series, No 587, Banque de France, April 2016.
- Early work comparing studies on employment effects in a meta-analysis is presented in Card, D. and Krueger, A.B., “Time-Series Minimum-Wage Studies: A Meta-analysis”, The American Economic Review, Vol. 85, No 2, May 1995, pp. 238-243. A more recent contribution by Cengiz, D., Dube, A., Lindner, A. and Zipperer, B., “The Effect of Minimum Wages on Low-Wage Jobs”, The Quarterly Journal of Economics, Vol. 134, Issue 3, August 2019, pp. 1405–1454, uses a difference-in-differences approach to observe both employment and wage effects across the entire frequency distribution of wages and, in particular, changes at the bottom of the distribution.


