Published as part of the ECB Economic Bulletin, Issue 3/2023.
Activities of multinational enterprises (MNEs) in Ireland are increasingly affecting euro area output and components of GDP. MNEs in Ireland contribute to domestic output by maintaining large production facilities, offering high-paid jobs and generating tax revenues. Over the past decade Ireland has also seen a large-scale onshoring of intellectual property products (IPP) by foreign-owned MNEs, in some cases coupled with the relocation of group headquarters (“redomiciliation”) to Ireland.[1] The associated transactions in these intangible assets are often unrelated to euro area business cycle dynamics, instead reflecting tax optimisation measures conducted by large foreign-owned MNEs. Such transactions can be sizeable, irregular and instantaneous, as moving these assets (e.g. software and patents) across borders does not require any physical relocation. In the quarter when the transaction is made, the resulting volatility in headline Irish and euro area real non-construction investment is largely GDP neutral as it is offset by real services imports.[2] IPP inflows nevertheless boost both the capital stock and exports in Ireland as well as the euro area, thus contributing positively to real GDP growth in subsequent quarters. This box examines these issues relating to IPP inflows, highlighting (i) their broadly neutral impact on within-quarter euro area GDP growth, despite volatile investment and import dynamics, and (ii) their positive cumulative impact on euro area GDP growth over the medium term.
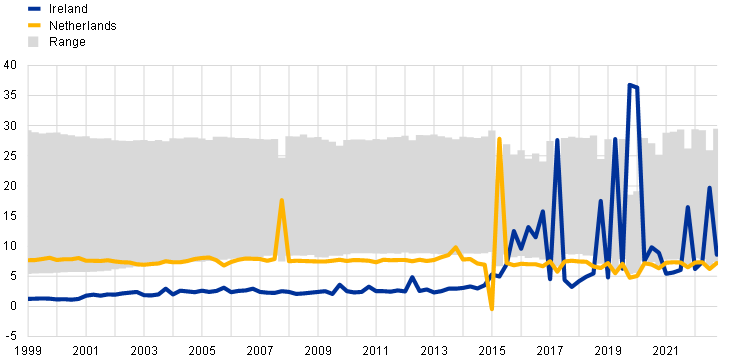
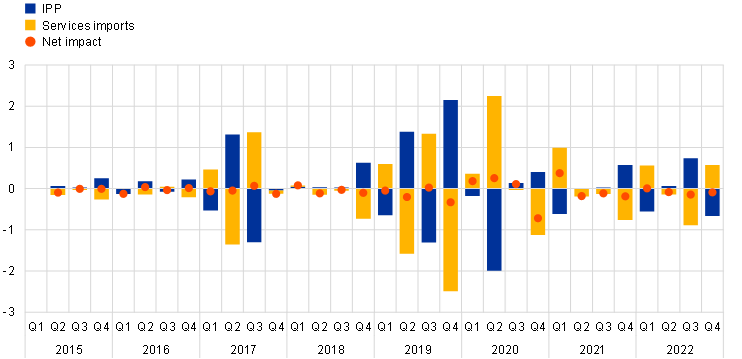
Transactions in intangible assets conducted by MNEs resident in Ireland have caused considerable volatility in quarterly euro area investment and import measures, but the within-quarter impact on euro area GDP growth has been broadly neutral. According to national accounts data, euro area non-construction investment and services imports have been particularly volatile over the past few years.[3] This is due mainly to IPP inflows to Ireland, which make up a disproportionately large share of euro area IPP investment in some quarters, thus blurring signals about the drivers of the euro area business cycle (Chart A).[4] IPP inflows to the Netherlands have also been particularly large on a few occasions. The within-quarter impact on euro area GDP growth of IPP transactions in Ireland is usually broadly neutral, owing to the offsetting effect of increases in services imports (Chart B).[5]
Chart A
Country shares of euro area IPP investment
(percentage of euro area IPP investment)

Sources: Eurostat and ECB staff calculations.
Notes: The range of countries includes Germany, Spain, France and Italy. The latest observations are for the fourth quarter of 2022.
Chart B
Contributions of Ireland’s IPP and services imports to euro area GDP growth
(percentage point contributions to quarter-on-quarter percentage changes in euro area GDP)

Sources: Eurostat and ECB staff calculations.
Notes: Values for the first and fourth quarters of 2020 have been interpolated. The latest observations are for the fourth quarter of 2022.
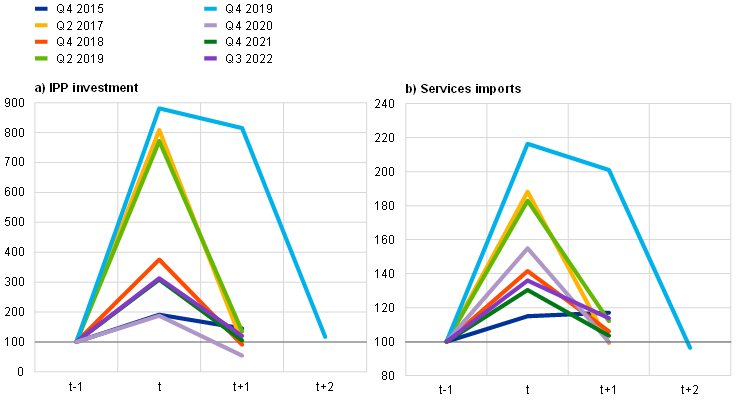
Although the occurrence of large IPP inflows to Ireland is hard to predict ex ante, ex post developments typically follow a fairly regular pattern. The timing of large IPP inflows has little to do with underlying business cycle dynamics, but instead often relates to tax optimisation decisions by individual MNEs, which are not pre-announced. This makes short-term forecasts of IPP transactions very difficult. There have been eight episodes since 2015 when quarter-on-quarter growth rates in IPP investment in Ireland exceeded 80%. In all but one of those episodes, quarter-on-quarter growth rates for both IPP investment and services imports returned to their pre-shock rates in the following quarter (Chart C). In the second half of 2022 Irish IPP dynamics were broadly in line with these historical patterns: a large IPP inflow to Ireland in the third quarter – resulting in a quarter-on-quarter growth rate of 213% in IPP investment – was followed by a much smaller inflow in the fourth quarter, implying a quarter-on-quarter decline of 61% in the level of IPP investment. The pattern for services imports was similar. Owing to the offsetting effect of services imports, the within-quarter impact of those IPP transactions on euro area GDP growth was therefore broadly neutral in both quarters.
Chart C
IPP investment and services imports levels in Ireland around quarters with large IPP inflows
(index: level in quarter immediately prior to significant IPP inflows = 100)

Sources: Eurostat and ECB staff calculations.
Notes: “t” denotes quarters in which there were significant IPP inflows to Ireland. The latest observations are for the fourth quarter of 2022.
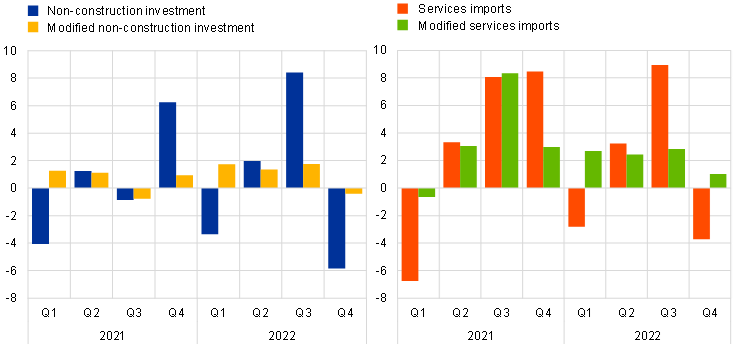
Modified investment and import data series can give a clearer picture of underlying dynamics in the real economy than the headline series. Ireland’s Central Statistics Office computes and publishes a modified data series that is designed to reflect domestic investment activity and abstracts from the erratic volatility seen in IPP data. The “modified investment” series is defined as total investment minus IPP investment and investment in aircraft purchased by leasing companies resident in Ireland.[6] A comparison shows that in the fourth quarter of 2022 euro area non-construction investment fell quarter on quarter by 0.4% according to the adjusted series, but by 5.8% according to the official data (Chart D). Proxies for services imports, calculated by subtracting IPP transactions from services imports, show a similar difference. These modified series exhibit smoother patterns that make it easier to assess the business cycle. Given that the IPP transactions that create the volatility have thus far mainly taken place with firms outside the euro area, the adjustment typically does not distort intra-euro area trade.
Chart D
Euro area non-construction investment and services imports with and without IPP investment in Ireland
(quarter-on-quarter percentage changes)

Sources: Eurostat, Ireland’s Central Statistics Office and calculations by staff at the Central Bank of Ireland and the ECB.
Note: The latest observations are for the fourth quarter of 2022.
IPP inflows nevertheless contribute positively to euro area GDP growth in subsequent quarters. Ireland, which accounted for 4% of euro area GDP in 2022, contributed disproportionately (around 18%) to the cumulative increase in euro area GDP between the fourth quarter of 2014 and the first quarter of 2023 (Chart E). This largely reflects long-term positive impacts on euro area GDP growth of onshored IPP, as these (i) boost the capital stock, which spurs both productivity and depreciation (consumption of capital); and (ii) generate higher export streams.[7] The income generated by IPP held in Ireland accrues mainly to foreign residents. Modified gross national income (GNI*), an indicator that corrects gross national income (GNI) for MNE-related income outflows and depreciation costs borne by foreign residents, is currently only around half the size of GDP.[8]
Chart E
Euro area GDP and contributions from Ireland
(cumulated euro area GDP from Q4 2014 to Q1 2023, EUR millions; contributions from Ireland and the rest of the euro area)

Sources: Eurostat and ECB staff calculations.
Note: The latest observations are for the first quarter of 2023.
The onshoring of intangible assets refers to IPP inflows, i.e. the transfer of assets, including patents, trademarks, copyrights, industrial processes and designs, from abroad to an entity residing in the reporting country.
Non-construction investment is defined as total investment minus construction investment. It is used as a proxy for business investment in the absence of such a variable in euro area national accounts data. For an insight into the impact on euro area investment of the quarterly volatility in IPP dynamics, see, for example, Box 1 in the article entitled “The recovery in business investment – drivers, opportunities, challenges and risks”, Economic Bulletin, Issue 5, ECB, 2022.
MNE activities, in particular investment in and imports of IPP, directly affect measures of GDP expenditure components. This is due to statistical changes implemented to, inter alia, incorporate research and development activities into these components. See European Commission (Eurostat), European System of Accounts 2010, Luxembourg, 2013, p.74.
For information on MNE activities, see United Nations Economic Commission for Europe, “The impact of globalization on national accounts”, United Nations, 2011. Although work is ongoing in the field of MNE activities, there is scope for data enhancements in both national accounts and balance of payments data, e.g. in terms of data on foreign-controlled non-financial corporations and the consolidation of MNE groups across borders. For further details, see Lane, P.R., “The analytical contribution of external statistics: addressing the challenges”, keynote speech at the Joint European Central Bank, Irving Fisher Committee and Banco de Portugal conference on “Bridging measurement challenges and analytical needs of external statistics: evolution or revolution?”, Lisbon, 17 February 2020.
For example, an MNE group entity residing in Ireland could buy the ownership rights of IPP, such as a piece of software, from a group entity residing in another jurisdiction. This would be recorded as an import of research and development services and as IPP investment under gross fixed capital formation.
Aircraft leasing companies in Ireland are mostly foreign-owned and manage around half of the global fleet of leased commercial aircraft. Their activities mainly affect the investment and trade components of GDP. In 2021 investment in aircraft for leasing purposes amounted to around 10% of total investment, compared with 45% for IPP investment. For more details, see Osborne-Kinch, J., Coates, D. and Nolan, L., “The Aircraft Leasing Industry in Ireland: Cross Border Flows and Statistical Treatment”, Quarterly Bulletin, No 1, Central Bank of Ireland, January 2017.
IPP-related export streams can arise from either higher services exports (e.g. software licences) or higher goods exports through contract manufacturing. In contract manufacturing, a firm hires a foreign company to produce a good but retains ownership of the inputs, including IPP. Exports from Ireland produced via contract manufacturing were usually offset by associated imports (particularly royalty payments for the use of intellectual property). However, with the onshoring of some IPP, fewer such payments need to be made and hence services imports no longer increase in line with the exports produced by contract manufacturers. See, for example, Irish Fiscal Advisory Council, “Pre-Budget 2017 Statement”, Box A, September 2016.
More specifically, the GNI* indicator published by Ireland’s Central Statistics Office adjusts GNI for the undistributed profits of redomiciled companies and the depreciation of IPP and leased aircraft.


