


Published as part of the ECB Economic Bulletin, Issue 6/2023.
One notable recent development in the euro area labour market has been a strong rebound in the labour force. In particular, over the last year and a half, the main source of employment growth has been the strong inflow of people joining the labour force rather than a sharp decline in the number of unemployed. This box provides an overview of recent euro area labour force developments using data from Eurostat and the ECB Consumer Expectations Survey (CES). It also analyses the drivers of the euro area labour force using a mixed-frequency Bayesian vector autoregression (MF-BVAR) to disentangle the push and pull factors behind the labour force dynamics.[1]
The labour force is now above its pre-pandemic level, which it reached at the end of 2022. More recently, it has converged back to its long-term pre-pandemic trend (Chart A), owing in particular to the contribution from foreign workers.[2] The difference between the short and long-term pre-pandemic trends captures the change in population growth, which has decelerated markedly since 2008. In June 2023, the labour force, inferred from monthly unemployment data, stood around 3.8 million above its January 2020 level. Detailed quarterly data from the EU Labour Force Survey (LFS) show that migrant workers, particularly from outside the EU, played an important role in labour force dynamics during the COVID-19 pandemic. In the first phase of the pandemic, from the fourth quarter of 2019 until the fourth quarter of 2020, the foreign labour force declined by proportionally more (2.0%) than the total labour force (1.2%). In contrast, from the first quarter of 2021 until the first quarter of 2023 foreign workers accounted for 41% of the total increase in the labour force, growing their share from 10.3% to 11.4% during that period.
Chart A
The euro area labour force and linear pre-pandemic trends
(index: Q4 2019 = 100)
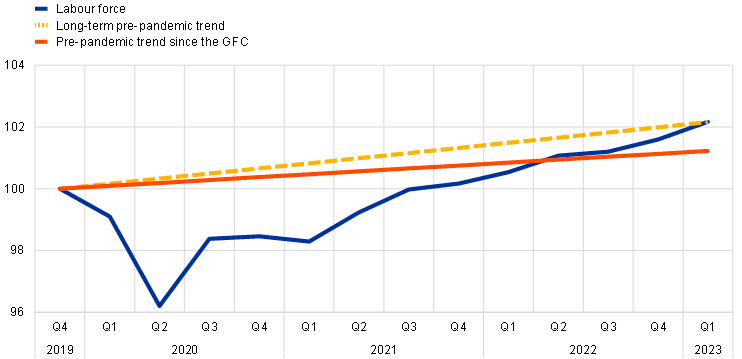
Sources: Eurostat, ECB area-wide model database and authors’ calculations.
Notes: The long-term pre-pandemic trend covers 1995-2019, while the pre-pandemic trend since the global financial crisis (GFC) covers 2009-2019. The latest observation is for the first quarter of 2023.
In recent years, an increasing share of newly employed in the euro area were previously inactive. Transitions from inactivity to employment (I-E transitions) were the main driver of the growth in employment. According to CES data, transitions from unemployment to employment (U-E transitions) accounted for 1.6% of total employment, whereas I-E transitions accounted for 2.8% (Chart B). This implies that only around 37% of new hires in the first half of 2023 had been unemployed in the previous quarter. This evidence is in line with Eurostat data showing that I-E transitions accounted for 60% of the newly employed in 2022, which is in contrast to the 2011-2019 period when U-E transitions accounted for 51% of the newly employed.[3]
Chart B
Transitions to employment
(share as a percentage of employment)
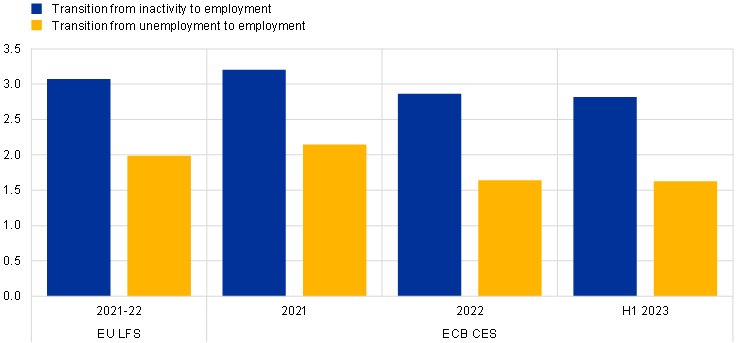
Sources: EU Labour Force Survey (LFS) and ECB Consumer Expectations Survey (CES).
Note: The latest observations are for April 2023.
According to the ECB CES, the characteristics of the newly employed and incumbents differ, including their labour income. On average, the newly employed are younger and have a lower level of education than incumbents (employed workers before the new transitions). They are also more likely to be women, work part-time and have lower levels of labour income (Chart C). Those hired from a position of unemployment earn about 55% of incumbents’ labour income, whereas those transitioning directly from inactivity to employment have an average level of labour income which is equivalent to approximately 80% of the level earned by incumbents. Individual and job characteristics only partially explain the labour income differences observed. However, the composition effects on overall wage growth induced by the labour income differences between the newly employed transitioning from inactivity and from unemployment are likely to be small.
Chart C
Characteristics of the newly employed
(share as a percentage of employment, percentages)
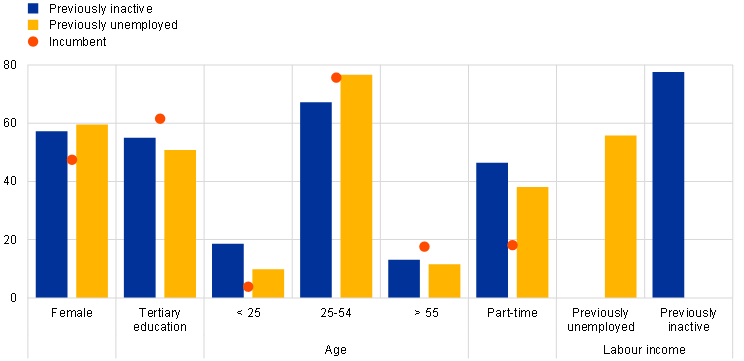
Source: ECB CES.
Notes: The right-hand columns show the labour income of the newly employed relative to that of incumbents. The latest observations are for April 2023.
The higher participation of previously inactive workers may alleviate labour market tightness. It may also contribute towards moderating wage growth, depending on the various factors driving up the labour force. If shifts in entry rates are driven by a positive demand shock (e.g. stronger demand for highly-skilled workers), then we should also observe upward wage pressure for incumbents, but if these shifts are driven by a positive supply shock (e.g. the inflow of migrants), then new labour force entrants may help to constrain incumbents’ wage demands.
We use an estimated model for the euro area to quantify the key drivers of the labour force and their relative importance over the cycle.[4] The model aims to identify the effects of the underlying forces from technology and aggregate demand conditions, as well as other drivers such as demographics, job search efforts or number of hours worked (labour supply), the mismatch between labour demand and supply, and the bargaining power of workers, reflecting, for instance, adjustments in minimum wages.
The model shows that aggregate demand and supply conditions have both been key drivers since the pandemic. Each bar in Chart D represents the individual contribution of structural shocks in deviations from the deterministic components estimated over the period from the first quarter of 1998 until the first quarter of 2023. Aggregate supply conditions (blue bars) and demand conditions (yellow bars) account for the bulk of the fall in the labour force during the pandemic and the rise during the post-pandemic recovery. These drivers account for technological changes, pandemic-related mobility restrictions, changes in aggregate demand and asymmetric sectoral changes.
Beyond this, labour market-specific shocks provided further labour force impetus. The rise in workers’ bargaining power (green bars) is probably associated with (i) the widespread increase in minimum wages, which has helped to encourage marginal workers back into the labour force, (ii) the decline in immigration during the COVID-19 years and (iii) growing labour shortages. The improved labour supply (red bars), in turn, is probably associated with the more recent catch-up in immigration flows. Misalignments between the demand and supply of sector-specific skills nevertheless continue to be a drag on the labour force, as captured by the growing negative contribution from the mismatch shock (turquoise bars).
Chart D
Model determinants of the labour force
(percentages; percentage point contributions)
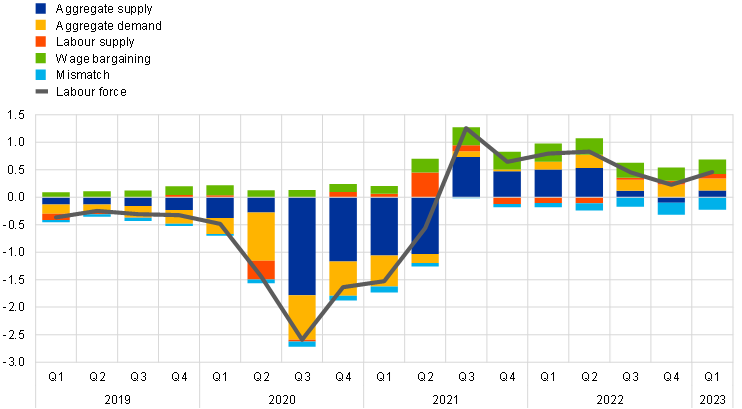
Sources: Eurostat and authors’ calculations.
Notes: See footnote 4 for more information on the model. The latest observations are for the first quarter of 2023.
To conclude, the strong increase in the labour force has important implications for understanding labour market dynamics and the cyclical position of the labour market. First, as there are more people willing to work in addition to those unemployed, a cyclical measure of labour market slack needs to take account of the increasing share of transitions from inactivity to employment. Second, all other factors being equal, the increase in the labour supply is likely to have a mitigating effect on wage pressure.
In addition to the analysis of labour force developments, a comprehensive analysis of the implications of employment growth for labour market tightness and wage growth needs to consider sectoral dimensions of the labour market and the contribution from average hours worked (intensive margin). See, for example, “More jobs but fewer working hours”, ECB Blog, 7 June 2023, on the differences between employment and total hours worked and the important role average hours worked played during the pandemic and the energy crisis. See also “The role of public employment during the COVID-19 crisis”, Economic Bulletin, Issue 6, ECB, 2022.
The increase in the euro area labour force was not homogeneous across socio-demographic groups. For instance, participation rates of low-skilled and prime-age workers have recovered less since the start of the pandemic (see Chart 9 in the article “The impact of the COVID-19 pandemic on the euro area labour market”, Economic Bulletin, Issue 8, ECB, 2020).
Taking into account the country composition in LFS labour market transitions, I-E transitions increased from 49% in the 2011-2019 period to 55% in the 2021-2022 period. The increase in I-E transitions relative to U-E transitions may also reflect a lower unemployment rate in the recent period. In the 2011-2019 period, the average unemployment rate was 10.2%, compared with 7.3% in the 2021-2022 period.
Based on Consolo, A., Foroni, C. and Martínez Hernández, C., “A Mixed Frequency BVAR for the Euro Area Labour Market”, Oxford Bulletin of Economics and Statistics, Vol. 85, No 5, October 2023, pp. 1048-1082. The empirical model is an MF-BVAR estimated using information on inflation, industrial production, wages, unemployment, job vacancies and the labour force. The model is an empirical representation of a general equilibrium model in which both aggregate and labour market-specific shocks determine the dynamics of the labour force.