


Published as part of the ECB Economic Bulletin, Issue 2/2024.
Food price inflation was one of the main contributors to the strong rise in euro area headline inflation in 2022 and, once food inflation started to decline, also to the disinflation thereafter. Food inflation increased to a historical peak of around 15% in March 2023, surpassed only by the earlier surge in energy inflation (Chart A). Since then, food inflation has declined, falling to 5.7% in January 2024, but is still above its pre-pandemic long-term average of 2.1%.[1] Food accounts for around 20% of expenditure in the overall Harmonised Index of Consumer Prices (HICP) basket and largely represents consumption “necessities”. This means that the surge in HICP food inflation had implications for household purchasing power, affecting those with lower incomes in particular. This box examines the main factors behind recent food price developments.
Chart A
Developments in euro area consumer food prices
(annual percentage changes)
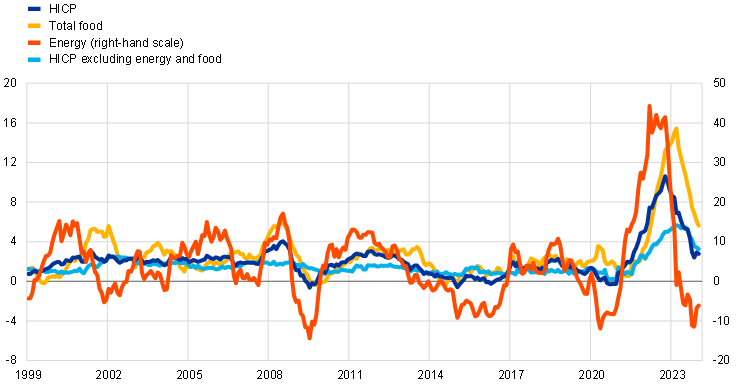
Sources: Eurostat and ECB calculations.
Note: The latest observations are for January 2024.
The strong rise in consumer food inflation from mid-2021 until early 2023 was observed for both main components: processed and unprocessed food. Processed food products make up the largest share of consumer expenditure on food (75%), with unprocessed food accounting for the rest. Input-output tables from Eurostat suggest that the cost structures for the processed and unprocessed food sectors are fairly similar, but there are some important differences. For processed food production, direct energy inputs account for around 2% of non-labour inputs, whereas for unprocessed food they account for around 7%. At the same time, gas and electricity (as opposed to oil) make up a larger share of energy inputs for processed food (around 80%) than for unprocessed food (around 50%). In addition, fertiliser inputs for unprocessed food production are almost as important as energy inputs. Furthermore, prices of unprocessed food are usually more strongly influenced by seasonal factors, including adverse weather conditions. Finally, for both components, intermediate food inputs comprise a large share of non-labour input costs (around 40% for unprocessed food and 50% for processed food), which means that food price developments can have important intra-sector spillover effects.
An extraordinary surge in energy costs was the main factor behind the increase in consumer food inflation in 2021 and 2022. In the course of 2021 oil prices picked up strongly as the global economy started to recover from the effects of the coronavirus (COVID-19) pandemic while oil supply was constrained. In addition, in the summer of 2021 European gas wholesale prices rose sharply, reflecting a combination of supply and demand factors. These developments were aggravated in early 2022 by the Russian invasion of Ukraine.[2] The surge in energy commodity prices led to a subsequent strong increase in energy producer prices and in fertiliser prices, which are closely linked to the gas price (Chart B). The extent of this increase in energy producer prices was exceptionally large from a historical perspective. The rise was especially strong for gas and electricity, with gas wholesale prices peaking in September 2022 at 440% above their December 2020 level. According to the Eurostat input-output tables for 2019, energy costs are estimated to account for around 3% of the total non-labour input costs of the food sector. While this share may seem small, the sheer size of the energy price shock implied sizeable increases in overall costs of production. At their peak, producer prices for energy (which mainly comprises electricity, gas and air conditioning) rose by almost 280% compared to the level in December 2020. Such an increase would imply an increase in total food sector non-labour input costs of around 9% (just for this specific input cost shock).
Chart B
Developments in the main input costs for consumer food prices
(index: January 2021 = 100)
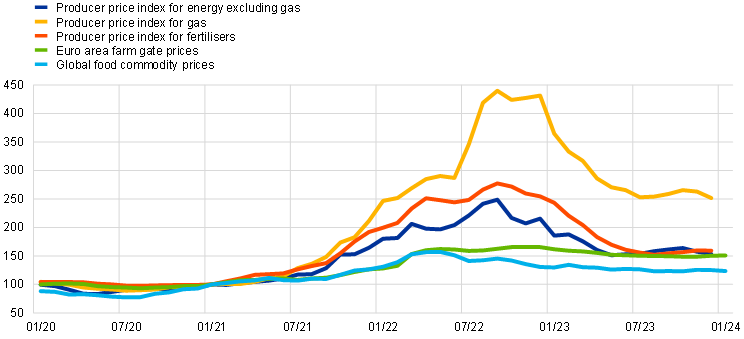
Sources: Eurostat, Hamburg Institute of International Economics (HWWI), ECB and ECB calculations.
Notes: Producer price indices refer to the euro area; global food commodity prices are in euro. The latest observations are for December 2023 for the producer price indices, and January 2024 for euro area farm gate prices and global food commodities.
Increases in global food commodity prices and in euro area farm gate prices also contributed significantly, partly reflecting the indirect effects of higher global energy prices, but also other factors.[3] After falling to low levels during the initial phase of the pandemic, prices for global food commodities, in particular maize, wheat and soybeans, began to recover in the second half of 2020 and continued to increase sharply in the course of 2021. This increase reflected a rebound in demand for feed in China, supply shortages driven partly by weather conditions in South America, and rising energy costs.[4] Wheat prices surged, particularly after the outbreak of Russia’s war against Ukraine, which caused global concerns about the grain supply from these two countries. Consequently, and reflecting developments in global food commodities as well as higher energy and fertiliser costs, euro area farm gate prices rose strongly. The increase was strongest for cereals, predominantly reflecting wheat prices, followed by higher prices for meat and dairy, as maize is an important feed for farm animals. These increases in euro area farm gate prices contributed to the rise in producer prices for the food industry, which was already facing higher direct energy costs of production. As energy and global food commodity prices started to ease in the middle of 2022, input price pressures softened. However, euro area farm gate prices remained elevated, which in part may have reflected persistently higher meat prices but also other domestic factors.[5] Additional upward pressure on global food commodity prices and euro area farm gate prices came from unfavourable global and local weather events, the frequency of which is gradually rising owing to climate change. Part of this upward pressure was subsequently passed on to consumer prices.[6] Overall, while the increase in consumer food prices was broad-based across various items, it was strongest for those more closely linked to food commodity inputs and with high energy use.
The important role of energy costs and, to a lesser extent, food commodities is corroborated by model results (Chart C). According to a Bayesian vector autoregression (BVAR) model, the deviation of food inflation from its longer-term average over the last two years was significantly driven by higher energy costs. Global food commodity prices (in euro) and euro area farm gate prices were also important drivers.[7] The impact of euro area farm gate prices shown in the model is what remains after the impact of energy producer prices has been accounted for. Similarly, the impact of euro area food sector producer prices shows the contribution from this sector to consumer prices after the impacts of energy, global food commodity and farm gate prices are accounted for. This means that the contribution from food sector producer prices shown in Chart C reflects factors stemming from the manufacturing leg of consumer food prices that are not related to energy and food input prices. Overall, taking this contribution together with the remaining unexplained contribution of the model, a significant part of the surge in food inflation remains unexplained.[8] This may reflect features that are not explicitly modelled owing to a scarcity of suitable data, for example for domestic factors such as wages and profits. These factors are relevant for both the manufacturing leg and the distribution and retailing leg of consumer food prices. The model may also fail to capture any non-linear impacts on food prices of the surge in energy costs.
Chart C
A model-based view of the drivers of euro area consumer food prices
(percentage point contributions to deviations from the long-term average)
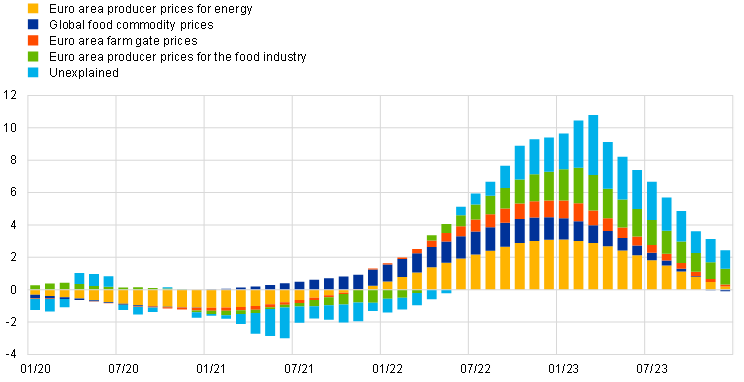
Source: ECB calculations.
Notes: The chart shows a BVAR-based decomposition of the drivers behind the deviation in euro area food inflation from its long-term average (and initial condition) using the ECB’s BEAR toolbox. Energy costs are proxied by the euro area producer price index for the energy sector. Global food commodity prices (in euro) are from HWWI; euro area farm gate prices are from the ECB, based on European Commission data. Identification of the drivers follows the Choleski decomposition as in Ferrucci, G., Jiménez-Rodríguez, R. and Onorante, L., “Food Price Pass-Through in the Euro Area: Non-Linearities and the Role of the Common Agricultural Policy”, International Journal of Central Banking, Vol. 8, March 2012, pp. 179-218, which imposes the following order of innovations: global food commodity prices, euro area producer prices for energy, euro area farm gate prices, producer prices in the food sector, consumer prices. This ordering is consistent with the pricing chain assumption. Estimation sample from December 1996 to December 2023.
Domestic factors – such as wage and profit developments – have gradually emerged as increasingly important factors behind the rise in consumer food prices. The model-based decomposition suggests that energy and food-related input prices cannot fully explain the surge in and subsequent high levels of consumer food inflation from around the second half of 2022 onwards (see “unexplained” in Chart C). As discussed above, one likely explanation is the contribution of domestic factors. For example, to compensate for workers’ real income losses, wages in the agricultural and food manufacturing sectors rose by 6.2% and 3.5% respectively year-on-year in 2022 and further by slightly above 5% in both sectors in the first three quarters of 2023 (Chart D).[9] Similarly, wages in the transportation and storage sector, which is an important leg of the food retail chain, increased by 4.3% in 2022 and 6.3% in the first three quarters of 2023. This means that wage growth in these sectors, partly reflecting increases in minimum wages, was somewhat above wage growth for the total economy.[10] While national accounts data show that unit profits in the agricultural sector rose strongly, profit data for the food manufacturing and food retail sectors are scarce. Even though volumes sold (measured by the retail sales deflated turnover index for food and beverages) declined somewhat over the period of high inflation, at the end of 2023 they stood only 1% below the level in 2019, but the price level was on average 26% higher than in 2019. This could suggest a sluggish demand reaction to price changes in the food sector.
Chart D
Developments in wages for selected sectors relevant for consumer food prices
(annual percentage changes)
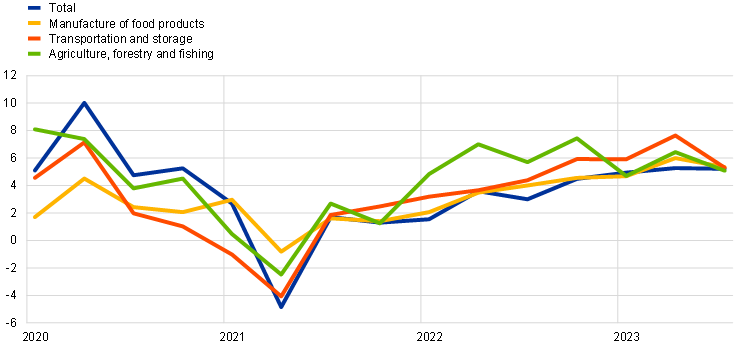
Sources: Eurostat and ECB calculations.
Notes: The latest observations are for the third quarter of 2023. The data for the manufacturing and transportation and storage sectors refer to gross wages and salaries per hour worked (from Eurostat short-term statistics), whereas the data for the total and for the agriculture, forestry and fishing sector refer to compensation per hour worked (from national accounts).
To sum up, euro area food inflation initially rose sharply owing to high energy and food commodity prices, while domestic factors have contributed towards keeping it elevated more recently. The exceptional, largely externally driven shocks to energy and food commodity prices are fading, and this is expected to contribute to a moderation in food inflation in the course of this year. This slowdown is expected to be gradual given the strong wage growth, particularly with rises in minimum wages.
Previous peaks in annual food price inflation reflected health concerns associated with animal diseases (5.6% in early 2002) and a rise in global food commodity and fertiliser prices (6.1% in 2008). For a review of food price developments during the COVID-19 pandemic, see the box entitled “Recent developments in euro area food prices”, Economic Bulletin, Issue 5, ECB, 2020, and the box entitled “The surge in euro area food inflation and the impact of the Russia-Ukraine war”, Economic Bulletin, Issue 4, ECB, 2022.
For a more detailed analysis of energy price developments in 2021-22, see the article entitled “Energy price developments in and out of the COVID-19 pandemic – from commodity prices to consumer prices”, Economic Bulletin, Issue 4, ECB, 2022.
The main difference between global food commodities and euro area farm gate prices is that the former are traded in global financial markets whereas the latter are prices paid to farmers in the euro area at the “farm gate” (i.e. as products leave the farm). Farm gate prices are reported to the European Commission’s Directorate-General for Agriculture and Rural Development by EU Member States and aggregated for the euro area by the ECB.
See “Commodity Markets Outlook: Urbanization and Commodity Demand”, World Bank Group, Washington, DC, October 2021. Licence: Creative Commons Attribution CC BY 3.0 IGO.
Prices for pigmeat and for beef and veal have remained elevated owing to declining domestic supply.
The effect of extreme weather may partially materialise through food commodity prices, especially if it is related to events outside of Europe. For example, there is evidence that the 2023-24 El Niño (a naturally occurring climate phenomenon which can result in extreme weather) is affecting global food commodity prices (see the box entitled “Risks to global food commodity prices from El Niño”, Economic Bulletin, Issue 6, ECB, 2023). However, extreme weather in Europe can also have direct impacts on consumer food prices, especially for products without a global market. This could concern, for example, prices of fresh fruit or vegetables. For example, extreme heat across Europe in the summer of 2022 is estimated to have added around 0.8 percentage points to euro area consumer food prices after one year (see Kuik, F., Modery, W., Nickel, C. and Parker, M., “The price of inaction: what a hotter climate means for monetary policy”, The ECB Blog, 12 December 2023). For more evidence, see also the box entitled “Main findings from the ECB’s recent contacts with non-financial companies”, Economic Bulletin, Issue 1, ECB, 2024.
The contribution from global food commodity prices may, however, also partly reflect higher global energy prices. In addition, since for the model analysis global food commodities are denominated in euro, the contribution according to the model may also reflect the impact of exchange rate fluctuations.
Even after accounting for a higher number of identified shocks (including energy and food commodity prices), a recent paper also finds that a large part of the surge in food inflation remains unexplained (see Bańbura, M., Bobeica, E. and Hernández, C.M., “What drives core inflation? The role of supply shocks”, Working Paper Series, No 2875, ECB, November 2023).
This compares to an average annual increase in wages and salaries for the agriculture and food manufacturing sectors of 1.6% and 1.9% respectively between 2009 and 2019. Calculations are based on Eurostat data.
In 2022 and in particular in 2023 minimum wages in many euro area countries increased and contributed to the overall wage growth. See the Box entitled “Minimum wages and their role for euro area wage growth”, Economic Bulletin, Issue 3, ECB, 2022.