

Published as part of the ECB Economic Bulletin, Issue 4/2025.
Financial conditions matter for economic activity and inflation. Financial conditions indices (FCIs) provide a consolidated measure of how easily and cheaply households, firms and governments can access financing, which in turn influences spending and investment decisions across the economy. Various FCIs have been proposed by practitioners and scholars. These differ in specification and scope, but typically include key financial variables such as interest rates, equity prices, corporate bond spreads and exchange rates.[1] Central banks, for instance, examine FCIs because these offer insights into how monetary policy decisions affect financial markets and, by extension, economic activity and inflation.
Stock prices are typically part of FCIs as these influence consumption and investment. Stock markets play a significant role in shaping decisions of households and firms. For instance, declining equity prices can weaken household’ consumption and borrowing capacity due to declines in wealth, potentially exacerbated by diminished confidence. Lower equity valuations can also have a direct impact on worker' pensions, affecting future retirement security and spending behaviour. For listed firms, lower equity prices can increase the cost of equity financing, making it more challenging for them to invest and expand. Declines in US equity prices since their peak in February have therefore tightened FCIs. However, since these declines occurred from potentially overvalued levels, this box examines whether the economic impact of such a tightening is different than in periods of equity prices being more aligned with historical norms.
Since late February 2025, US financial conditions have started to tighten as risky assets sold off amid waning US growth expectations and uncertainty surrounding tariffs. When proxying the US FCI by a weighted average of short-term and long-term interest rates, corporate credit spreads, the cyclically adjusted price-to-earnings (CAPE) ratio for the S&P 500, and the US nominal effective exchange rate – in the spirt of Arrigoni et al. – we observe a significant tightening during April (Chart A, panel a).[2] The optimism of market participants about the US growth outlook started to fade due to a series of unfavourable data releases, including faltering consumer confidence. On 2 April announcement by the US Administration of large-scale reciprocal tariffs triggered a sharp sell-off in US equities and corporate bond markets, resulting in increased financial market volatility and widening credit spreads. Combined with rising recession concerns in the United States and retaliatory measures announced by China, these events triggered the S&P 500 index to drop by 12% in the space of a few days. Equity prices rebounded following the suspension of reciprocal tariffs on 9 April and the China-US trade agreement of 12 May, although the S&P 500 index remained 3.8% on May 30 below its historical peak reached in February. Consequently, the US FCI tightened to levels last seen in early 2023, before easing back to levels seen prior to 2 April.[3] A daily Bayesian vector autoregression (BVAR) model, which identifies the driving factor behind this tightening in the US FCI, confirms that most of it was due to adverse shocks to the domestic macro outlook in the United States (Chart A, panel b).[4]
US equity prices remain at levels that had raised overvaluation concerns. Measures of US stock valuations indicate that equity valuations overall remain high compared with usual benchmarks. The CAPE ratio for the S&P 500 currently stands at around 34, above the 75th percentile of its historical distribution. This suggests that the equity market is still more expensive than indicated by historical norms (Chart B, panel a), even though it slightly came down from its all-time high of 36. During such periods of stretched valuations, the contribution of equity price changes to overall US FCI developments tends to be large, reflecting the weight of equities in this specific index as well as the remarkable equity price returns when stock prices enter the overvaluation range (Chart B, panel b). For instance, when the CAPE is above its 75th percentile, the equity price component accounts for around 40% of the variation in the FCI, more than doubling its contribution compared with a situation when it is below the 75th percentile.
Chart A
Components of the US financial conditions index (FCI)
a) Components of the US FCI
(standardised index, cumulative changes since 2 January 2020)

b) Components of the US FCI and structural drivers since the S&P 500 February peak
(standardised index, cumulative changes since 19 February 2025)
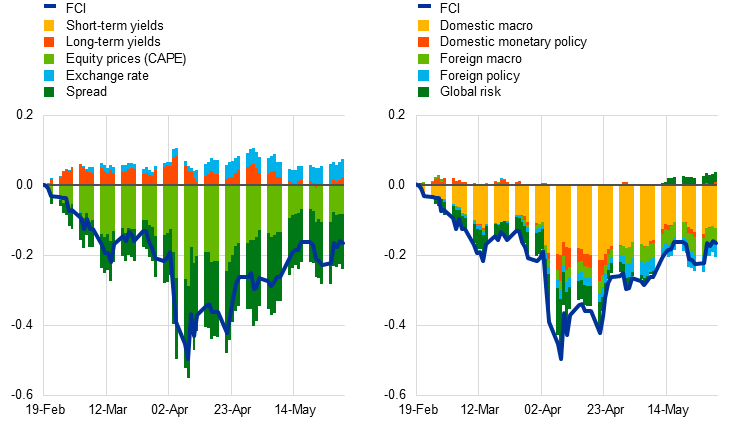
Sources: LSEG and ECB staff calculations.
Notes: The FCI is computed as a weighted average of five financial variables, i.e. 10-year government bond yields, short-term interest rates, cyclically adjusted price-to-earnings (CAPE) ratio, the nominal effective exchange rate and corporate spreads. The charts show changes since January 2020 (panel a) and since 19 February 2025 (panel b) and the latest observation is for 22 April 2025 (daily data). The structural decomposition is derived from a daily structural BVAR model for the United States using short-term interest rates, 10-year government bonds yields, USD NEER, CAPE ratio and corporate spreads. A combination of sign, relative magnitude and narrative restrictions is used based on an extended version of the BEAR toolbox, see Dieppe, A., van Roye, B. and Legrand, R., “BEAR toolbox”, Working Paper Series, No 1934, ECB, Frankfurt am Main, July 2016.
Chart B
Contribution of equity prices to the US FCI contingent on equity valuations levels
a) CAPE | b) Contribution of equity prices to US FCI changes contingent on S&P 500 CAPE |
(ratio) | (percentages) |
 |  |
Sources: LSEG and ECB staff calculations.
Notes: Panel a: The sample spans the period since the beginning of 1995. “Pre-correction” refers to the historical peak of the S&P 500 on 19 February 2025. The latest observation is for 6 May 2025 (daily data). Panel b: Share of changes in equity variables relative to absolute overall changes in the FCI since 1995.
Empirical analysis suggests that the influence of financial conditions on economic activity weakens when equity markets are highly valued. To explore whether the impact of financial conditions is contingent on the state of the US equity market, we apply a two-step procedure. First, we focus on the part of our US FCI measure that is driven by domestic macro shocks, as estimated in the BVAR model. This is because these shocks capture the shifts in market participants’ perception of the US macroeconomic outlook, which were the important driver behind the recent tightening in the US FCI (Chart A, panel b). Focusing on this aspect also helps filter out changes in the FCI that may have less direct connections to US economic growth, such as shifts in global risk sentiment. Second, to determine whether the economic effect is dependent on the state of the equity market, we estimate the impact of US macro-driven FCI changes on future US economic activity using local projection methods that allow for non-linear interaction effects based on the S&P 500 CAPE ratio. Our findings suggest that the adverse effect of an FCI tightening on US activity is considerably weaker when equity markets are above the 75th percentile, although there is significant uncertainty around such estimates (Chart C). While our analysis does not delve into the specific reasons behind the weaker signal observed during periods of elevated equity valuations, there may be several contributing factors.[5] During such periods, equity price changes tend to disproportionately affect high-income households, which are more heavily invested in stocks and generally have a lower marginal propensity to consume. Additionally, if aggregate equity price movements are dominated by a handful of companies that are not representative of the broader economy, such as the “Magnificent Seven” – the seven largest US tech companies – the signal may be weakened further.
Chart C
Impact of US macro-driven FCI tightening on US GDP after one year contingent on the level of equity valuation
(x-axis: CAPE ratio, y-axis: percentages)
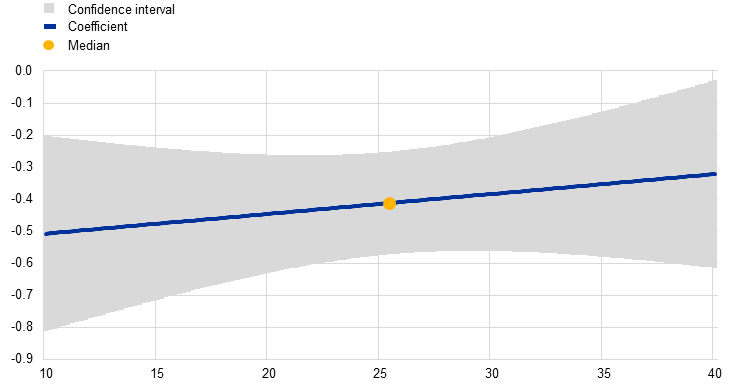
Source: ECB staff calculations.
Notes: The chart shows the response of US GDP to a one standard deviation shock of the US FCI driven by domestic macro shocks on GDP growth estimated via local projections. The change in the US FCI driven by macro shocks is interacted with the CAPE ratio, lagged by one month. The impact is shown after 12 months. The sample is based on monthly data from 1995 to February 2025.
In conclusion, a change in financial conditions should not be assessed mechanically, in particular as inflated equity prices can skew financial conditions and potentially weaken their economic growth signal. While the broad indication provided by an FCI is valuable, policymakers and analysts should remain attentive to the role of individual components and the broader economic context, especially during periods of stretched valuations.
See, among others, Davis, E.P. et al., “The Estimation of Financial Conditions Indices for the Major OECD Countries”, OECD Economics Department Working Papers, 1335, OECD Publishing, 2016; International Monetary Fund, Global Financial Stability Report, Chapter 3, April 2017; Goldman Sachs, “Financial conditions: A unified approach”, Research Note, 2016; and Arrigoni, S. et al., “The simpler, the better: Measuring financial conditions for monetary policy and financial stability”, Working Paper Series, No 2451, ECB, 2021.
Both the choice of variables and the weights are as in Arrigoni, S. et al., op. cit., who based their choice on the FCIs developed by Goldman Sachs, where the weights are based on the effects of the financial variables on real GDP growth over a one-year horizon. One difference is that the FCI in this analysis employs the CAPE ratio of the S&P 500, rather than the traditional price-to-earnings ratio used in the original paper, but the weight of the equity index in the FCI is the same (25%). A high weight attributed to equity prices in this specific FCI might affect the results.
It is important to note that this index comprises only a limited set of variables, and other indices might weight equities differently, potentially leading to somewhat different interpretations.
The BVAR model is based on Chiṭu, L., Grothe, M., Schulze, T. and Van Robays, I., “Financial shock transmission to heterogeneous firms: the earnings-based borrowing constraint channel”, Working Paper Series, No 2860, ECB, 2023.
For caveats on the use of FCIs, see also Bullard, J.B., “What Do Financial Conditions Indexes Tell Us?”, The Regional Economist, Federal Reserve Bank of St. Louis, March 2023.