
- STATISTICAL RELEASE
Euro area insurance corporation statistics: third quarter of 2020
1 December 2020
- Total assets of euro area insurance corporations amounted to €8,825 billion in third quarter of 2020, €108 billion higher than in second quarter of 2020
- Total insurance technical reserves of euro area insurance corporations rose to €6,719 billion in third quarter of 2020, up €72 billion from second quarter of 2020
Total assets of euro area insurance corporations increased to €8,825 billion in the third quarter of 2020, from €8,718 billion in the second quarter of 2020. Debt securities accounted for 40.8% of the sector's total assets in the third quarter of 2020. The second largest category of holdings was investment fund shares (26.7%), followed by equity (10.4%) and loans (7.4%).
Holdings of debt securities increased to €3,599 billion at the end of the third quarter of 2020 from €3,568 billion at the end of the previous quarter. Net sales of debt securities amounted to €16 billion in the third quarter of 2020; price and other changes amounted to €47 billion (see Chart 1). The year-on-year growth rate of debt securities held was 0.1%.
Looking at holdings by issuing sector, the annual growth rate of debt securities issued by euro area general government was -1.2% in the third quarter of 2020, with net sales in the quarter amounting to €10 billion. As regards debt securities issued by the private sector, the annual growth rate was 1.7%, with quarterly net purchases close to € 0 billion. For debt securities issued by non-euro area residents, the annual growth rate was 0.6%, with quarterly net sales of €6 billion.
Chart 1
Insurance corporations' holdings of debt securities by issuing sector
(quarterly transactions in EUR billions; not seasonally adjusted)

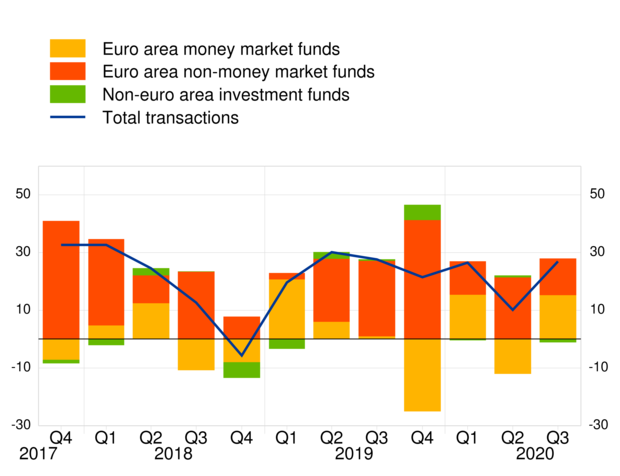
Turning to insurance corporations' holdings of investment fund shares, these increased to €2,355 billion in the third quarter of 2020, from €2,294 billion in the previous quarter, with net purchases of €27 billion and price and other changes of €34 billion (see Chart 2). The year-on-year growth rate in the third quarter of 2020 was 3.8%.
The annual growth rate of euro area money market fund shares held by insurance corporations was -4.2% in the third quarter of 2020, with net purchases in the quarter amounting to €15 billion. As regards holdings of euro area non-money market fund shares, the annual growth rate was 4.3%, with quarterly net purchases amounting to €13 billion. For investment fund shares issued by non-euro area residents, the annual growth rate was 7.6%, with quarterly net sales of €1 billion.
Chart 2
Insurance corporations' holdings of investment fund shares by issuing sector
(quarterly transactions in EUR billions; not seasonally adjusted)
In terms of main liabilities, total insurance technical reserves of insurance corporations amounted to €6,719 billion in the third quarter of 2020, up from €6,647 billion in the second quarter of 2020 (see Annex, Table 1). Life insurance technical reserves accounted for 90.7% of total insurance technical reserves in the third quarter of 2020. Unit-linked products amounted to €1,278 billion, accounting for 21.0% of total life insurance technical reserves.
For queries, please use the statistical information request form.
Notes:
- "Other assets" includes currency and deposits, insurance technical reserves and related claims, financial derivatives, non-financial assets and remaining assets.
- "Private sector" refers to euro area excluding general government.
- "Investment funds" includes money market funds and non-money market funds.
- Hyperlinks in the main body of the statistical release and in the annex table lead to data that may change with subsequent releases as a result of revisions. Figures shown in the annex table are a snapshot of the data as at the time of the current release.
- 1 December 2020