
The ECB Survey of Professional Forecasters - Fourth quarter of 2024
Summary
In the ECB’s Survey of Professional Forecasters (SPF) for the fourth quarter of 2024, expectations for headline HICP inflation were largely unchanged from the previous survey (conducted in the third quarter of 2024), although expectations for 2025 were revised downwards slightly.[1] Headline inflation was expected to decline from 2.4% in 2024 to 1.9% in both 2025 and 2026 (unchanged apart from a 0.1 percentage point downward revision for 2025). Longer-term HICP inflation expectations (for 2029) were also unchanged at 2.0%. Respondents continued to expect a strengthening of real GDP growth from a modest 0.7% in 2024, to 1.2% in 2025 and 1.4% in 2026. These figures were unchanged apart from 0.1 percentage point downward revision for 2025, which mainly reflected a carry-over from weaker than previously expected economic activity in the second half of 2024. Longer-term GDP growth expectations were unchanged at 1.3%. Respondents expected the unemployment rate to increase to an average of 6.5% in 2024 and 2025 but to decline slightly thereafter to 6.4% in 2026 and in the longer term. This implies an overall unchanged profile of unemployment rate expectations.
Table 1
Results of the SPF in comparison with other expectations and projections
(annual percentage changes, unless otherwise indicated)
Survey horizon | ||||
|---|---|---|---|---|
2024 | 2025 | 2026 | Longer term1) | |
HICP inflation | ||||
Q4 2024 SPF | 2.4 | 1.9 | 1.9 | 2.0 |
Previous SPF (Q3 2024) | 2.4 | 2.0 | 1.9 | 2.0 |
ECB staff macroeconomic projections (September 2024) | 2.5 | 2.2 | 1.9 | - |
Consensus Economics (October 2024) | 2.4 | 1.9 | 1.9 | 2.0 |
Memo: HICP inflation excluding energy, food, alcohol and tobacco | ||||
Q4 2024 SPF | 2.8 | 2.2 | 2.0 | 2.0 |
Previous SPF (Q3 2024) | 2.7 | 2.2 | 2.0 | 2.0 |
ECB staff macroeconomic projections (September 2024) | 2.9 | 2.3 | 2.0 | - |
Consensus Economics (October 2024) | 2.8 | 2.2 | - | - |
Real GDP growth | ||||
Q4 2024 SPF | 0.7 | 1.2 | 1.4 | 1.3 |
Previous SPF (Q3 2024) | 0.7 | 1.3 | 1.4 | 1.3 |
ECB staff macroeconomic projections (September 2024) | 0.8 | 1.3 | 1.5 | - |
Consensus Economics (October 2024) | 0.7 | 1.2 | 1.4 | 1.3 |
Unemployment rate2) | ||||
Q4 2024 SPF | 6.5 | 6.5 | 6.4 | 6.4 |
Previous SPF (Q3 2024) | 6.5 | 6.5 | 6.4 | 6.4 |
ECB staff macroeconomic projections (September 2024) | 6.5 | 6.5 | 6.5 | - |
Consensus Economics (October 2024) | 6.5 | 6.6 | - | - |
1) Longer-term expectations refer to 2029.
2) As a percentage of the labour force.
1 Headline HICP inflation expectations revised very slightly downwards
SPF respondents’ headline inflation expectations over the short and medium term were broadly unchanged, albeit slightly lower for 2025. Inflation expectations for 2024 and 2026 remained unchanged at 2.4% and 1.9% respectively, while they edged down (by 0.1 percentage points) to 1.9% for 2025 (see Chart 1). Respondents indicated that they see the disinflation process in the euro area as continuing broadly as expected. The main factors mentioned as explaining the limited revisions to previous expectations were oil prices and expected softer economic growth in the second half of 2024. Compared with the September 2024 ECB staff macroeconomic projections, inflation expectations in this SPF round were lower by 0.1 percentage points for 2024 and by 0.3 percentage points for 2025 but the same for 2026 (see Table 1).
Chart 1
Inflation expectations: overall HICP inflation and HICP inflation excluding energy and food
(annual percentage changes)
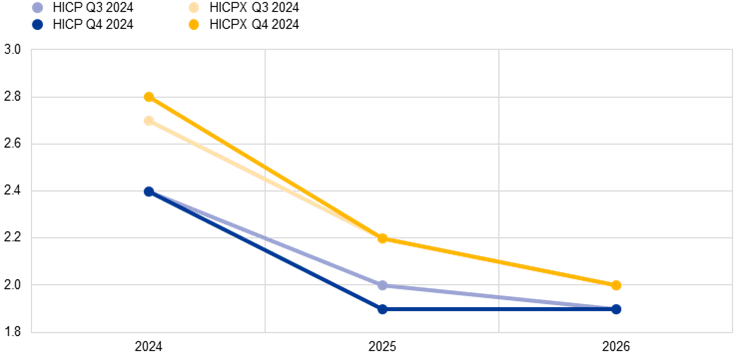
SPF expectations for inflation excluding energy and food (HICPX) were revised upwards slightly for 2024 but essentially unchanged for 2025 and 2026. HICPX expectations for 2024, 2025 and 2026 stood at 2.8%, 2.2% and 2.0% respectively. These were revised upwards by 0.1 percentage points for 2024 and were unchanged for 2025 and 2026. It is likely that the upward revision reflects higher than previously expected data outturns. Nonetheless, respondents continue to expect a downward profile owing primarily to the expectation that wage growth and services inflation will both gradually moderate. SPF forecasts for HICPX are 0.1 percentage points lower than those in the September 2024 ECB staff macroeconomic projections for 2024 and 2025 but the same for 2026 (see Table 1).
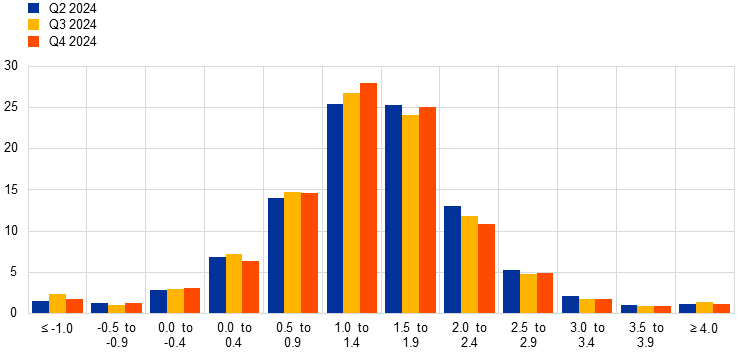
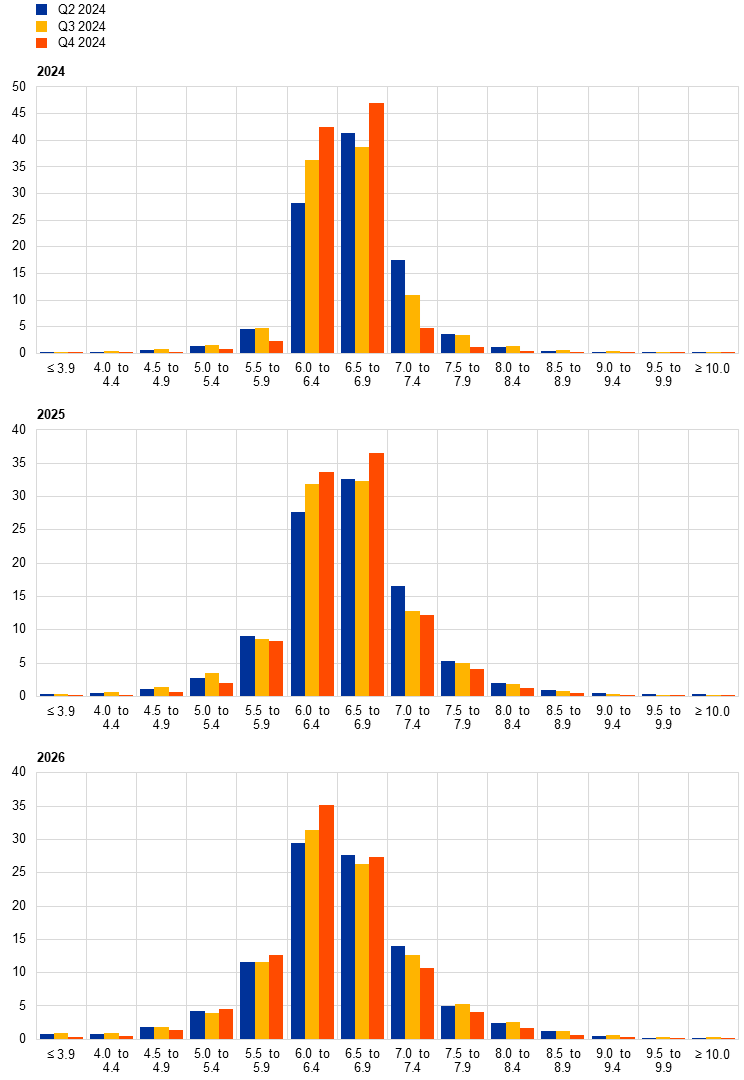
Uncertainty surrounding the shorter and medium-term inflation outlook decreased, while the balance of risks was tilted somewhat to the upside.[2],[3] Quantitative indicators of uncertainty surrounding the shorter and medium-term inflation outlook eased noticeably but still remained above levels observed prior to Russia’s invasion of Ukraine. Levels were lower than those seen around the turn of 2022-2023 but remained above those seen prior to then. The elevated level of aggregate uncertainty is primarily due to high individual uncertainty as disagreement across forecasters has fallen substantially in recent survey rounds. Aggregate probability distributions for the calendar years from 2024 to 2026 are presented in Chart 2. While the lower individual uncertainty may be due in part to a change in the bins, the lower disagreement would also suggest some genuine reduction in uncertainty.[4] The balance of risk indicator remained close to being broadly balanced, albeit very slightly to the downside. Consistent with this, the probability associated with longer-term inflation being below the range 1.8-2.2% was 34%, slightly higher than the probability (31%) associated with longer-term inflation being above this range. The probability associated with longer-term inflation being in the range 1.8-2.2% was 35%.
Chart 2
Aggregate probability distributions for expected inflation in 2024, 2025 and 2026
(x-axis: HICP inflation expectations, annual percentage changes; y-axis: probability, percentages)
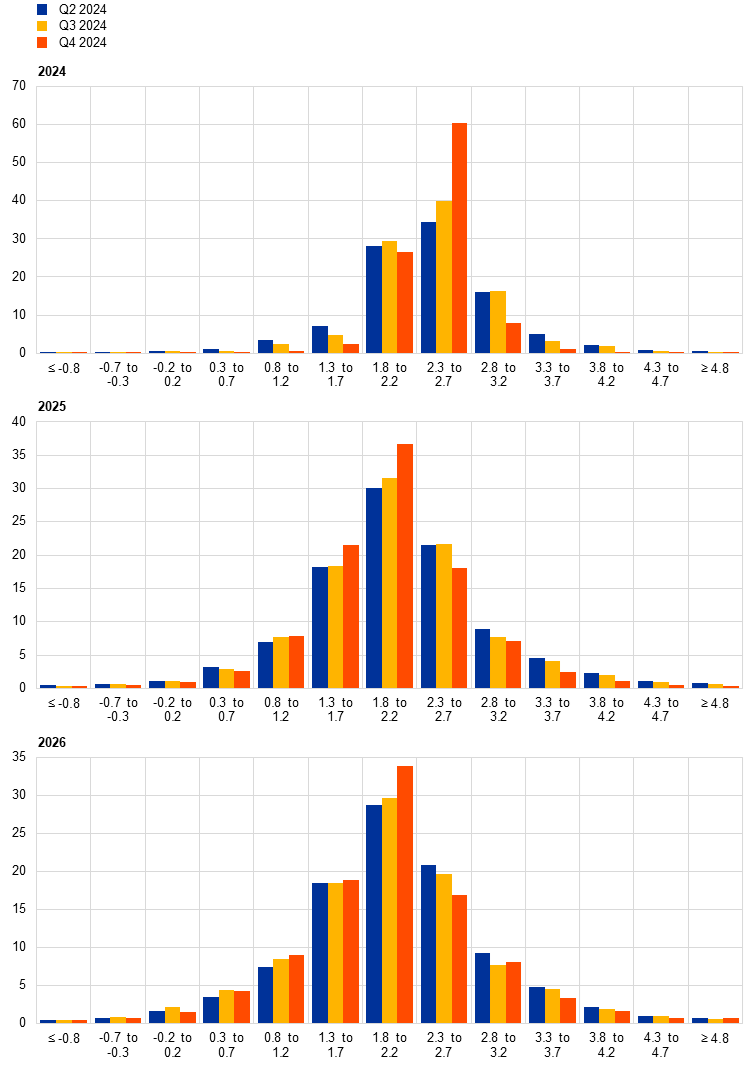
Notes: The SPF asks respondents to report their point forecasts and to separately assign probabilities to different ranges of outcomes. This chart shows the average probabilities assigned to different ranges of inflation outcomes in 2024, 2025 and 2026. In this survey round (Q4 2024) there was a change in the bins surveyed for HICP and HICPX expectations. While the bin widths remain unchanged at 0.5 percentage points, the bins are now centred symmetrically around 2% (the central bin being 1.8-2.2%). Data for previous survey rounds shown in the chart have been backcast by fitting a cubic spline to the aggregate cumulative density function.
2 Longer-term inflation expectations unchanged at 2.0%
Longer-term inflation expectations (for 2029) were unchanged at 2.0%. The move back to target (after expectations had stood at around 2.1% following the Russian invasion of Ukraine in early 2022 and the subsequent spike in energy and food prices) is evident in Chart 3. This profile also holds when excluding the two highest and lowest responses. Considering a balanced panel of 38 respondents who also responded in the third quarter of 2024 survey round, more than two thirds left their long-term inflation expectations unchanged.[5] The modal and median values of the distribution of individual point forecasts were both unchanged at 2.0%, and the shape of the cross-sectional distribution was also largely unchanged (see Chart 4). Again, for the fourth consecutive survey round, at least half of the respondents reported longer-term inflation expectations of 2.0%. Compared with the previous survey round, the histogram of individual point forecasts was largely similar, with more than three quarters of participants reporting 1.9-2.1%.
Chart 3
Longer-term inflation expectations
(annual percentage changes)
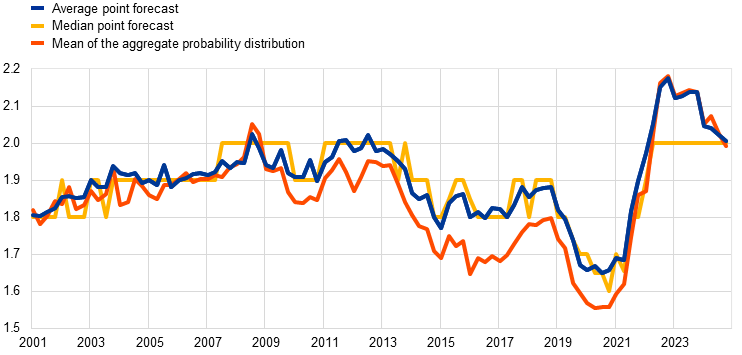
Chart 4
Distribution of point expectations for HICP inflation in the longer term
(x-axis: longer-term HICP inflation expectations, annual percentage changes; y-axis: percentages of respondents)
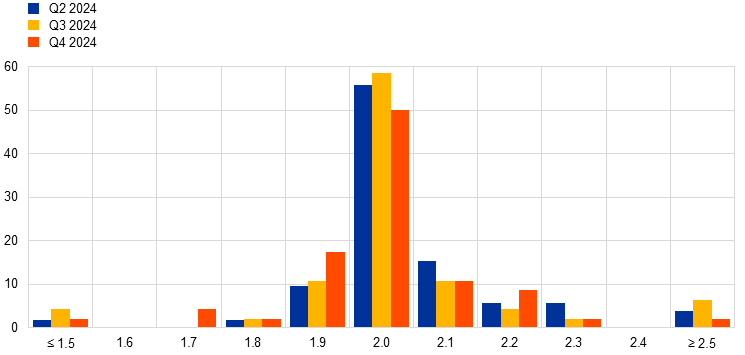
Notes: The SPF asks respondents to report their point forecasts and to separately assign probabilities to different ranges of outcomes. This chart shows the spread of point forecast responses. In the Q3 and Q4 2024 survey rounds, longer-term expectations refer to 2029; in the Q2 2024 round, they referred to 2028.
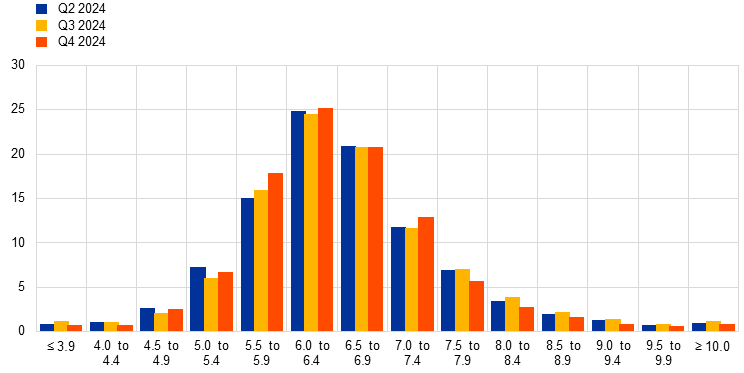
Uncertainty surrounding the longer-term inflation expectations eased, while the balance of risks remained broadly balanced. Aggregate uncertainty decreased in this survey round reflecting a combination of lower disagreement regarding point forecasts as well as lower individual uncertainty. While the lower individual uncertainty may be due in part to the change in the bins, the lower disagreement would also suggest some genuine reduction in uncertainty. The balance of risk indicator remained close to being broadly balanced, albeit very slightly to the downside. Consistent with this, the probability associated with longer-term inflation being below the range 1.8-2.2% was 34%, slightly higher than the probability (31%) associated with longer-term inflation being above this range. The probability associated with longer-term inflation being in the range 1.8-2.2% was 35% (see Chart 5).
Chart 5
Aggregate probability distribution for longer-term inflation expectations
(x-axis: HICP inflation expectations, annual percentage changes; y-axis: probability, percentages)

Notes: The SPF asks respondents to report their point forecasts and to separately assign probabilities to different ranges of outcomes. This chart shows the average probabilities assigned to different ranges of inflation outcomes in the longer term. In the Q3 and Q4 2024 survey rounds, longer-term expectations refer to 2029; in the Q2 2024 round, they referred to 2028. In this survey round (Q4 2024) there was a change in the bins surveyed for HICP and HICPX expectations. While the bin widths remain unchanged at 0.5 percentage points, the bins are now centred symmetrically around 2% (the central bin being 1.8-2.2%). Data for previous survey rounds shown in the chart have been backcast by fitting a cubic spline to the aggregate cumulative density function.
The mean longer-term expectation for HICPX inflation was unchanged at 2.0%.[6] The median and modal longer-term point expectations for HICPX were also unchanged at 2.0%. While the evolution of longer-term expectations for HICP and HICPX inflation has been broadly similar since the fourth quarter of 2016 (when respondents were first asked about their expectations for HICPX inflation), there has been some narrowing of the gap (previously 0.1 percentage points) in the latest four survey rounds.
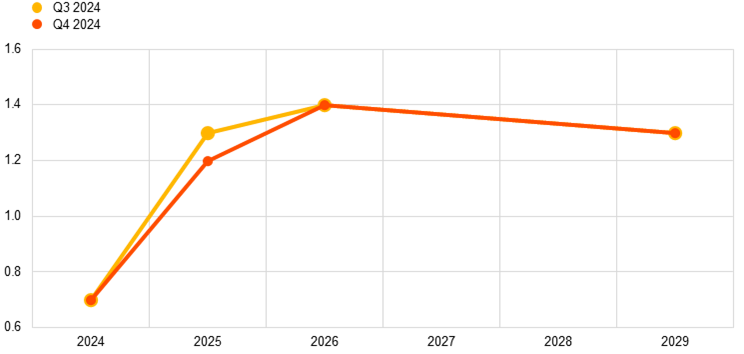
3 Real GDP growth expectations revised downwards for 2025
GDP growth expectations stood at 0.7% for 2024, 1.2% for 2025 and 1.4% for 2026 (see Chart 6). Compared to the previous survey round, these figures imply a slight downward revision (around 0.1 percentage points) for 2025 but an essentially unchanged profile for 2024 and 2026. Overall, these calendar year figures are lower than the projections for 2024-2026 in the September 2024 ECB staff macroeconomic projections. The longer-term growth expectations (for 2029) stood unchanged at 1.3%.
Chart 6
Expectations for real GDP growth
(annual percentage changes)
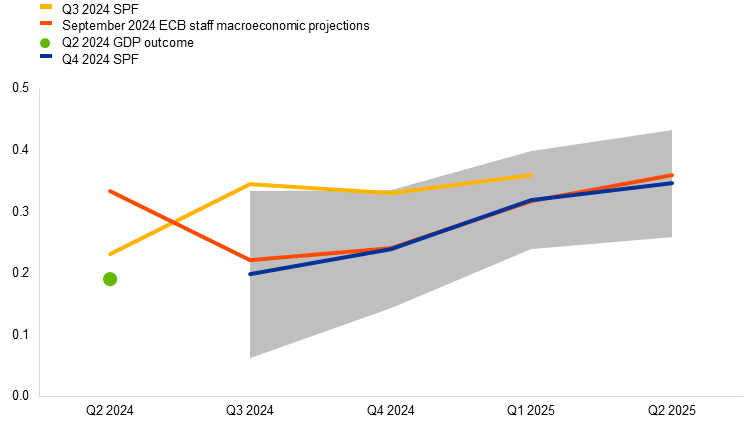
The revised outlook for 2025 was mainly justified by a carry-over from downward revisions for the third and fourth quarters of 2024 (down 0.14 and 0.10 percentage points respectively) relative to the previous SPF round. Overall, the short-term GDP outlook was revised downwards throughout 2024, although the dynamics still point to a gradual strengthening of economic activity in the coming quarters (see Chart 7). The revisions to the outlook for the second half of 2024 mainly stemmed from weak leading indicators and low business and consumer confidence and were driven by the weaker-than-expected reaction of private consumption to falling inflation. Expectations for quarter-on-quarter growth from the third quarter of 2024 to the second quarter of 2025 were very much in line with those in the September 2024 ECB staff macroeconomic projections.
Chart 7
Expected profile of quarter-on-quarter GDP growth
(quarter-on-quarter percentage changes)
Note: The grey area indicates one standard deviation (of individual expectations) around average SPF expectations.
Expectations for real GDP growth rates imply only a very small change in the expected level of economic activity compared with the previous survey round, and it is still significantly below the level expected before Russia’s invasion of Ukraine. Compared with the survey round conducted in early January 2022, prior to the Russian invasion of Ukraine, the expected level of real GDP for 2026 is down by around 4% (see Chart 8).
Chart 8
Forecast profile of real GDP
(index: 2022 = 100)

Note: Growth expectations for years not surveyed have been interpolated linearly.
Compared to the previous survey round, the balance of risks turned to the downside for the two-year ahead horizon but remained in positive territory in the longer term, while uncertainty increased marginally in the short-term and decreased slightly over the five-year-ahead horizon (see Chart 9 and Chart 10). Aggregate uncertainty currently stands at lower levels than before Russia’s invasion of Ukraine for both horizons – especially for two years ahead – but it is still above pre-pandemic levels, while the balance of risks two years ahead returned to negative territory after briefly turning positive in the previous survey round for the first time since the Q2 2023 SPF. By contrast, the balance of risks for the longer term remains in positive territory and has improved compared to pre-invasion levels.
Chart 9
Aggregate probability distributions for GDP growth expectations for 2024, 2025 and 2026
(x-axis: real GDP growth expectations, annual percentage changes; y-axis: probability, percentages)

Notes: The SPF asks respondents to report their point forecasts and to separately assign probabilities to different ranges of outcomes. This chart shows the average probabilities assigned to different ranges of real GDP growth outcomes in 2024, 2025 and 2026.
Chart 10
Aggregate probability distributions for longer-term GDP growth expectations
(x-axis: real GDP growth expectations, annual percentage changes; y-axis: probability, percentages)
Notes: The SPF asks respondents to report their point forecasts and to separately assign probabilities to different ranges of outcomes. This chart shows the average probabilities assigned to different ranges of real GDP growth outcomes in the longer term. In the Q3 and Q4 2024 survey rounds, longer-term expectations refer to 2029; in the Q2 2024 round, they referred to 2028.
4 Unemployment rate expectations unchanged
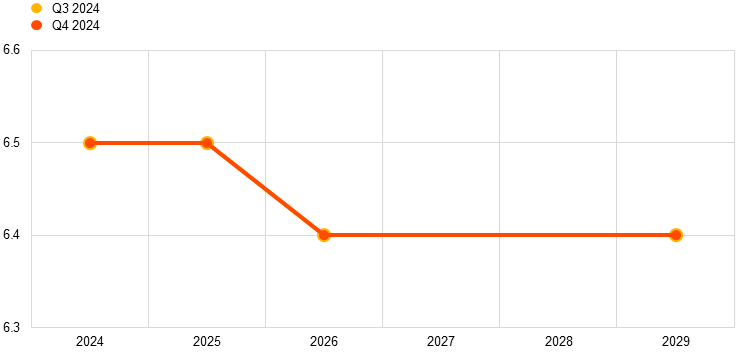
In the third quarter of 2024 survey round, respondents expected unemployment rates of 6.5%, 6.5% and 6.4% in 2024, 2025 and 2026 respectively. The expectations profile was unchanged across all horizons (see Chart 11), as were longer-term expectations at 6.4% (for 2029). Although respondents noted that labour markets continued to be more robust than previously expected, particularly within the services sector, they pointed to potential upward pressures on unemployment owing to slower economic growth, reduced profits and a sharp rise in wages, which could dampen labour demand. In addition, respondents noted that falling interest rates could drive firms to substitute labour with capital, adding further upward pressure on unemployment in the near term.
Chart 11
Expectations for the unemployment rate
(percentages of the labour force)
Compared with the previous survey round, the level of uncertainty surrounding the unemployment rate expectations decreased. Aggregate uncertainty (as measured by the standard deviation of the aggregate distributions – see Chart 12 and Chart 13) decreased across all horizons, returning to close to pre-pandemic levels. Respondents noted a generally strong labour market, albeit with an asymmetric outlook across Europe. Labour markets in southern euro area economies, especially in the services sector, are expected to remain resilient, while respondents see upside risks to unemployment in the two largest euro area economies (Germany and France).
Chart 12
Aggregate probability distributions for the unemployment rate in 2024, 2025 and 2026
(x-axis: unemployment rate expectations, percentages of the labour force; y-axis: probability, percentages)
Notes: The SPF asks respondents to report their point forecasts and to separately assign probabilities to different ranges of outcomes. This chart shows the average probabilities assigned to different ranges of unemployment rate outcomes for 2024, 2025 and 2026.
Chart 13
Aggregate probability distribution for the unemployment rate in the longer term
(x-axis: unemployment rate expectations, percentages of the labour force; y-axis: probability, percentages)
Notes: The SPF asks respondents to report their point forecasts and to separately assign probabilities to different ranges of outcomes. This chart shows the average probabilities assigned to different ranges of unemployment rate outcomes in the longer term. In the Q3 and Q4 2024 survey rounds, longer-term expectations refer to 2029; in the Q2 2024 round, they referred to 2028.
5 Expectations for other variables
Forecasters expected the ECB’s deposit facility rate (DFR) to fall to 3.2% in the fourth quarter of 2024 and further to 2.2% by 2026. They expected the euro to appreciate marginally against the US dollar, from 1.10 in the fourth quarter of 2024 to 1.12 in 2026, and oil prices to remain around USD 75 to 76 per barrel from the fourth quarter of 2024 to 2026. They also expected nominal wages to increase by 4.4% in 2024, with wage growth subsequently moderating to 3.3% in 2025 and 2.8% both in 2026 and in the longer term.
Chart 14
Expectations for other variables
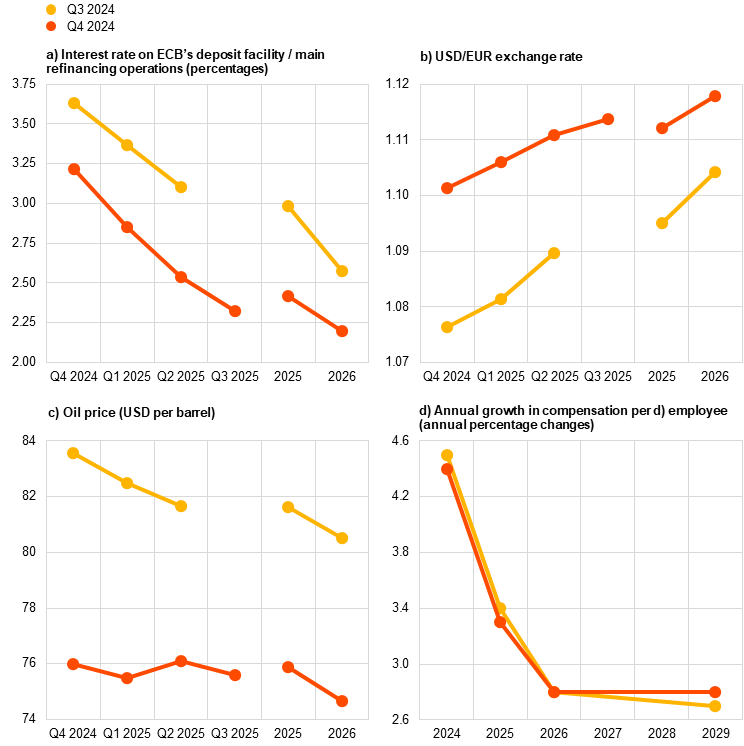
Notes: In this survey round (Q4 2024), respondents were asked, for the first time, to provide their assumptions/forecasts for the DFR and not for the main refinancing operations (MRO) rate as in previous survey rounds (including the Q3 2024 survey round).
Respondents expected the DFR to fall to 3.2% in the fourth quarter of 2024 and to 2.85%, 2.55% and 2.3% in the first three quarters of 2025 respectively, before falling further to 2.2% in 2026. Compared with the previous survey round, expectations were revised downwards by between 0.4 and 0.6 percentage points (see Chart 14, panel a). This downward revision reflects a combination of the change in the policy rate surveyed (the DFR in this survey round and the MRO rate in previous rounds) and lower expected policy rates (about 20 basis points lower for the DFR and 20-40 basis points lower for the MRO rate).[7]
On average, the USD/EUR exchange rate was expected to rise from USD 1.10 in the fourth quarter of 2024 to USD 1.12 in 2026 (see Chart 14, panel b). The expected trajectory is similar to that in the previous survey round, albeit at a slightly higher level.
Compared with the previous survey round, the expected level of US dollar-denominated oil prices was revised downwards over the entire survey horizon by around USD 6 to 7 per barrel (see Chart 14, panel c).
Expectations for annual growth in compensation per employee were revised downwards by 0.1 percentage points for 2024 and 2025, to 4.4% and 3.3% respectively. The downward revisions reflect the slightly lower inflation forecasts as well as the slightly weaker near-term labour market outlook. There was no change in expectations of wage growth of 2.8% in 2026, while longer-term expectations (2029) were revised up by 0.1 percentage points to 2.8% (see Chart 14, panel d).
Annex (chart data)
Excel data for all charts can be downloaded here.
© European Central Bank, 2024
Postal address 60640 Frankfurt am Main, Germany
Telephone +49 69 1344 0
Website www.ecb.europa.eu
All rights reserved. Reproduction for educational and non-commercial purposes is permitted provided that the source is acknowledged.
For specific terminology please refer to the https://www.ecb.europa.eu/home/glossary/html/index.en.html (available in English only).
PDF ISBN 978-92-899-6458-6, ISSN 2363-3670, doi:10.2866/710254, QB-BR-24-004-EN-N
HTML ISBN 978-92-899-6457-9, ISSN 2363-3670, doi:10.2866/63175, QB-BR-24-004-EN-Q
The survey was conducted between 1 and 3 October 2024 and 56 responses were received. All participants were provided with the same set of the latest available data for annual HICP inflation (September 2024: overall inflation, 1.8%; underlying inflation, 2.7%), annual GDP growth (second quarter of 2024: 0.6%) and unemployment (August 2024: 6.4%). This report was drafted on the basis of data available on 10 October 2024.
The width of the reported probability distributions indicates the perceived degree of overall uncertainty, whereas the asymmetry of the distributions indicates whether that uncertainty is more concentrated on higher or lower outturns – i.e. it measures the perceived balance of risks. As regards uncertainty, it can be shown that the width (or standard deviation) of the aggregate probability distribution (i.e. “aggregate uncertainty”) is a function of the average width (or standard deviation) of the individual probability distributions (i.e. “individual uncertainty”) and the standard deviation of the individual point forecasts (i.e. “disagreement”).
The balance of risk indicator is defined as the mean of the aggregate probability distribution minus the mean of the individual point forecasts.
The SPF asks respondents for their point forecasts and separately to assign probabilities to different ranges of outcomes. In this survey round (Q4 2024), there was a change in the bins surveyed for HICP and HICPX expectations. While the bin widths remain unchanged at 0.5 percentage points, the bins have shifted and are now centred symmetrically around 2.0%. While previously the bins were 1.0-1.4%, 1.5-1.9%, 2.0-2.4%, 2.5-2.9%, etc., they are now 1.3-1.7%, 1.8-2.2%, 2.3-2.7%, etc.
Of the 38 respondents who provided longer-term HICP inflation expectations in both the third and fourth quarters of 2024, 26 made no changes to their forecasts, seven revised them downwards and five revised them upwards.
Of the 26 respondents who provided longer-term HICPX inflation expectations in both the third and fourth quarters of 2024, 19 made no changes to their forecasts, five revised them upwards and two revised them downwards.
In this SPF round (Q4 2024), respondents were asked, for the first time, to provide their assumptions/forecasts for the DFR and not for the MRO rate. Although changes to the operational framework were published in March 2024, in the previous two SPF rounds (Q2 and Q3 2024) it was noticed that most respondents (two-thirds) had not incorporated the narrowed MRO-DFR spread into their assumptions. It was estimated that only 15 basis points of the 35 basis point narrowing had been incorporated (leaving 20 basis points not incorporated). Consequently, in this survey round it is likely that approximately 20 basis points of the downward revision can be attributed to the change in the policy rate surveyed (from the MRO rate to the DFR) and the remainder (20-40 basis points) to lower expected monetary policy rates.
-
18 October 2024