Social spending, a euro area cross-country comparison
Published as part of the ECB Economic Bulletin, Issue 5/2019.
At a time of high government indebtedness, low structural economic growth and ageing populations, a key element in today’s policy debate is the role of government in providing its services and distributing resources to society. Government decisions on tax and social benefit systems have an important bearing on macroeconomic performance in the euro area. This article focuses on how social spending on individual households or on the provision of collective goods and services is organised in euro area countries. Choices made concerning the level and structure of social spending are country-specific and reflect societal policy preferences. The aim of this article is to review government social spending across euro area countries and how it has evolved since the pre-crisis period. It also zooms in on the different social insurance systems in euro area countries in terms of pensions and health and looks at spending on education. We devote particular attention to the analysis of pensions, as pensions represent the biggest social spending item in all countries. The article suggests that countries should look for policies and reforms to ensure the sustainability of social spending, especially in view of ageing populations and possible negative economic shocks.
1 Introduction
Inequality is now at the centre of the international policy agenda because growing inequalities have the potential to undermine future economic development and reduce intergenerational social mobility and social cohesion. In particular, government decisions on tax and social benefit systems have a large bearing on macroeconomic performance. In this context, policymakers are seeking to identify the most coherent composition of public finances to foster “inclusive growth”. The policy guidelines on fiscal and structural reforms under the country-specific recommendations (CSRs)[1] issued under the European Semester are also supportive of the inclusive growth agenda.
Public finance theory divides government functions into allocation, stabilisation and distribution.[2] First, governments intend to achieve an efficient use of resources in the economy. Second, fiscal policies are important in stabilising income and consumption over the economic cycle.[3] Third, fiscal policies are also instrumental in mitigating income inequality resulting from market forces (market inequality). Redistribution can be measured as the percentage reduction in market income inequality due to direct government action (via direct taxes and cash transfers).
Social spending can be defined as government expenditure on social protection, education and health.[4] These resources are intended to relieve households of the financial burden of a number of risks and basic needs. In practice, a large part of social spending is in the form of social transfers in cash made directly to individual households, such as pensions, unemployment and sickness benefits and social assistance benefits. Other spending is provided in kind, either on a collective basis, i.e. directly produced and distributed by the government, or on an individual basis, distributing market goods and services to individual households (or reimbursing the costs thereof). As explained in Box 1, these different ways of providing public goods and services have a significant impact – directly or indirectly – on household disposable income and, consequently, on consumption.
Social spending can be analysed by using classification of the functions of government (COFOG) data.[5] The delineation of social spending includes distributive expenditure on social protection and pre-distributive expenditure that supports long-term growth (e.g. education and, to a lesser extent, health). Investment in infrastructure is also conducive to growth, according to economic literature, but it does not fall within our categorisation of social spending.
Social spending represents the largest component of government expenditure in all euro area countries, and pension payments make up the largest share. Social spending has increased steadily since 2001,[6] both in nominal terms and as a percentage of total government expenditure, albeit with some volatility expressed as a percentage of GDP during the crisis period. In the euro area in 2017, social spending accounted for, on average, around 70% of total government expenditure (see Table 1) and amounted to 31% of GDP, or €3.5 trillion. Social protection is by far the largest component of social spending in euro area countries, accounting for, on average, 42% of total government expenditure and around 20% of GDP. There are clear differences between countries in the level of social protection, which accounts for one third of total government expenditure in Malta and Latvia and approximately half in Finland and Germany. The main component in every country is expenditure on pensions (old age and survivors’), which averages 12.4% of GDP, followed by sickness and disability, families and children, unemployment and social housing. Despite the pension reforms undertaken in many euro area countries, pensions represent the main burden for governments. On the other hand, euro area countries have contained expenditure on health and education in recent years. Expenditure on health and education, respectively, represents on average 7.1% and 4.5% of GDP (or 15% and 9.6% of total government expenditure).
Table 1
Breakdown of social spending by COFOG function (euro area, 2017)

Source: Eurostat.
There is no one-size-fits-all optimal level of social spending as a share of the economy. The optimal composition of social spending takes into account microeconomic factors (e.g. the efficiency of social spending systems) and macroeconomic factors (e.g. the size of the fiscal multipliers). This is an argument for growth-friendly fiscal instruments, based on the underlying idea that the composition of public finances has an impact on long-term output. It involves political choices and societal preferences – such as the optimal size of government,[7] the fiscal governance framework, and the tax system to finance social spending. It also has implications for debt sustainability, interaction with other economic policies, demography and existing political capital for implementing fiscal-structural reforms in a satisfactory manner. In fact, political pressure to reverse reforms that burden older citizens could grow as a consequence of the increasing age of the median voter. In addition, as the ratio of contributors to beneficiaries shrinks, questions of intergenerational fairness arise.
Social insurance systems and the way public goods and services are provided differ substantially across euro area countries. Countries’ systems did not converge over the last decade, as societal preferences are different. Some countries have a “public-integrated model” which links budgetary financing with providers of goods and services that are part of the general government sector. In other countries, the government predominantly purchase the goods and services from market producers under a “public-contract model”. Therefore social spending is represented differently in national accounts across countries, affecting the interpretation of cross-country comparisons. Estimates of social security pension obligations are also diverse across countries, depending on whether pension schemes are more publicly or privately organised. In general, a majority of euro area countries have significant publicly organised schemes, while the Netherlands and, to a lesser extent, Ireland also have considerable private pillars.
As a consequence of this diversity, a comprehensive assessment of social spending requires the analysis of microeconomic data and tax systems in individual countries. Aggregate data need to be interpreted with caution and complemented with further studies. For instance, it is important to monitor closely the costs incurred in the provision of public services and to further analyse the efficiency of public spending in the context of spending reviews (i.e. how to maximise the economic effect of spending using the available resources). Regarding the tax systems in place, apart from the progressivity of direct and indirect taxes and the efficiency of the tax administration, there is widespread use of tax exemptions on pensions, health or housing in euro area countries. It is difficult to calculate the impact of these exemptions on the government accounts and their mitigating effect on income distribution. However, that is outside the scope of this article.[8]
This article is structured as follows: Section 2 analyses the evolution of social spending since the pre-crisis years and its linkages to household disposable income and consumption; Section 3 discusses the distributive function of public finance in euro area countries, with a descriptive analysis of the differences in social insurance systems and a focus on pensions as the largest social spending item in every euro area country; and Section 4 concludes.
2 The evolution of the composition of social spending in the euro area
The euro area has witnessed an increase in both its overall and its social expenditure-to-GDP ratio, albeit with some volatility during the crisis period. Chart 1 illustrates trends in cyclically adjusted primary expenditure relative to GDP and the social spending categories at euro area level during the period 2001-2017. During the pre-crisis phase (Phase I), primary expenditure (i.e. total government expenditure minus interest payments) was relatively stable. During the financial crisis, the sharp deterioration in GDP in 2008-2010 was accompanied by a temporary spending stimulus (Phase II). This was reflected in the increase in the cyclically adjusted primary expenditure ratio. After the financial crisis peaked in 2010, the primary expenditure ratio started declining (Phase III), reflecting euro area countries’ adjustment policies in view of rising debt sustainability concerns. Since the normalisation of fiscal policies in 2014 (Phase IV), the primary expenditure ratio has remained stable at around 45% of GDP, one percentage point of GDP above the pre-crisis level.
Chart 1
Euro area cyclically adjusted primary expenditure and breakdown of social spending
(percentages of potential GDP at current prices)

Sources: European Commission (AMECO and Eurostat) and ECB calculations.
Notes: Phase I is the pre-crisis period (2001-2007). Phase II is the first part of the crisis (2008-2010), when most countries responded with emergency expenditure increases. Phase III is the consolidation phase (2011-2013), although some countries had already started consolidating before then (e.g. Latvia in 2009). Significant progress in reducing fiscal imbalances was achieved by 2013. Phase IV is the post-crisis period (since 2014). In several countries the consolidation period continued beyond 2013 (e.g. Greece, Cyprus). Pensions include old age and survivors’ pensions. Unemployment benefits data are cyclically adjusted.
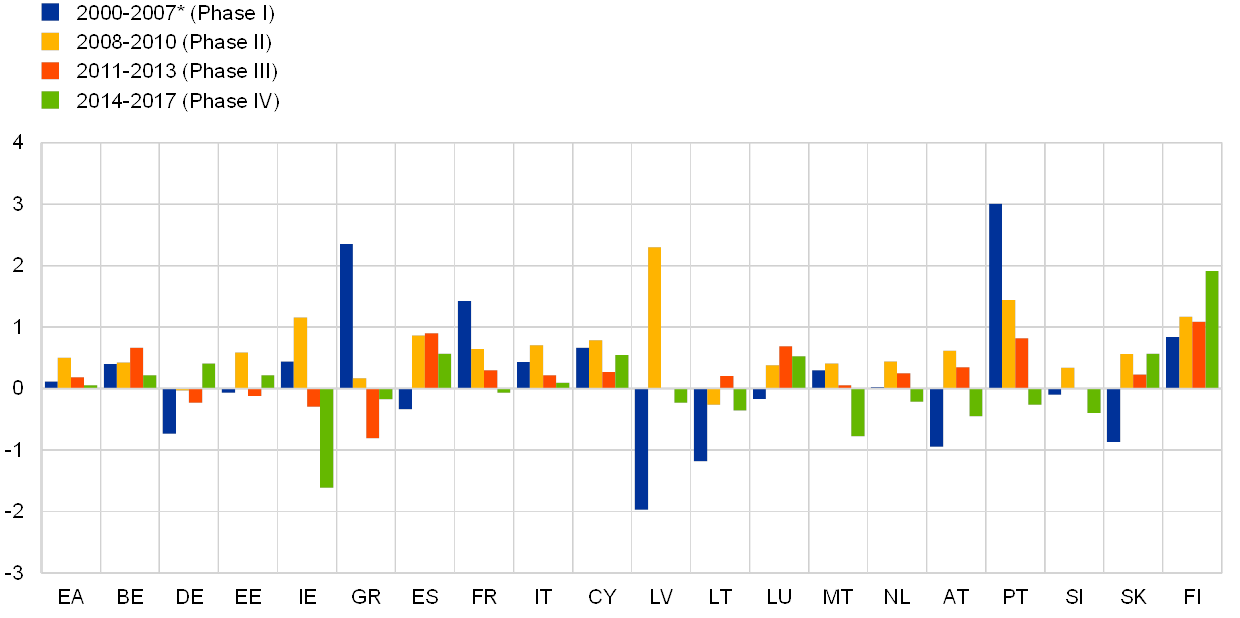
Pension spending in the euro area generally rose faster than potential GDP as a result of ageing populations. As shown in Chart 2, before the onset of consolidation, increases in pension expenditure as a percentage of potential GDP (Phases I and II) were particularly strong in Portugal, Greece, France and Finland. On the other hand, several countries experienced increases below the increases in their potential GDP, particularly during the period 2000-2007 (Phase I). This was the case for Latvia, Lithuania, Austria, Slovakia, Germany and Spain in particular. During the consolidation period (Phase III), increases in pension expenditure relative to potential GDP continued in a majority of countries, while reductions occurred notably in Greece and Ireland. However, these reductions were smaller than the increases in the years before. Germany and Estonia also witnessed drops in pension expenditure as a percentage of potential GDP. After 2013, pension expenditure continued increasing faster than potential GDP in about half of euro area countries, most notably in Finland.[9] This reflects the rising share of older people in the population, but also the effects of the previously legislated pension reforms and lower potential GDP growth in the post-crisis period. Looking ahead, at the euro area aggregate level substantial changes in the old-age dependency ratio are projected, moving from over three working-age people for every person aged 65 or over to only around two working-age people by 2070.[10] Pressure from an ageing society will therefore continue to limit governments’ fiscal room for manoeuvre in the coming years.
Chart 2
Government pension expenditure in euro area countries
(cumulative changes, percentage points of potential GDP)
Sources: European Commission (AMECO and Eurostat) and ECB calculations.
Notes: Pensions include old age and survivors’ pensions. Cumulative changes in percentage points of potential GDP refer to the ratio of nominal pension expenditure based on COFOG data (numerator) to nominal potential GDP (denominator) calculated using real potential GDP at 2010 reference levels (AMECO database) and the GDP deflator. Potential output estimates for Ireland are heavily influenced by the activities of large multinational enterprises (MNEs) and therefore subject to a particularly high degree of uncertainty.
* Data for Germany and Lithuania start from 2001; data for Belgium, Greece, Italy, Latvia, Malta Slovakia, Finland and the euro area start from 2002.
The impact of policy changes after the onset of the crisis is most visible for health expenditure, as growth in health spending is slowing down in most countries and in the euro area as a whole. As illustrated in Chart 3, significant increases in expenditure on health as a percentage of potential GDP were recorded in a majority of euro area countries in the period before the consolidation, leading to a rise in the health expenditure ratio at the euro area level. Only Germany and Slovenia saw health expenditure growth slightly below that of potential GDP. The start of the crisis marked a trend shift, as most countries experienced a slowdown in health spending which also continued in many countries in the consolidation and post-consolidation periods. Since the crisis, health expenditure has grown less than potential GDP for at least some of the time in a majority of countries.
Chart 3
Government expenditure on health in euro area countries
(cumulative changes, percentage points of potential GDP) Sources: European Commission (AMECO and Eurostat) and ECB calculations.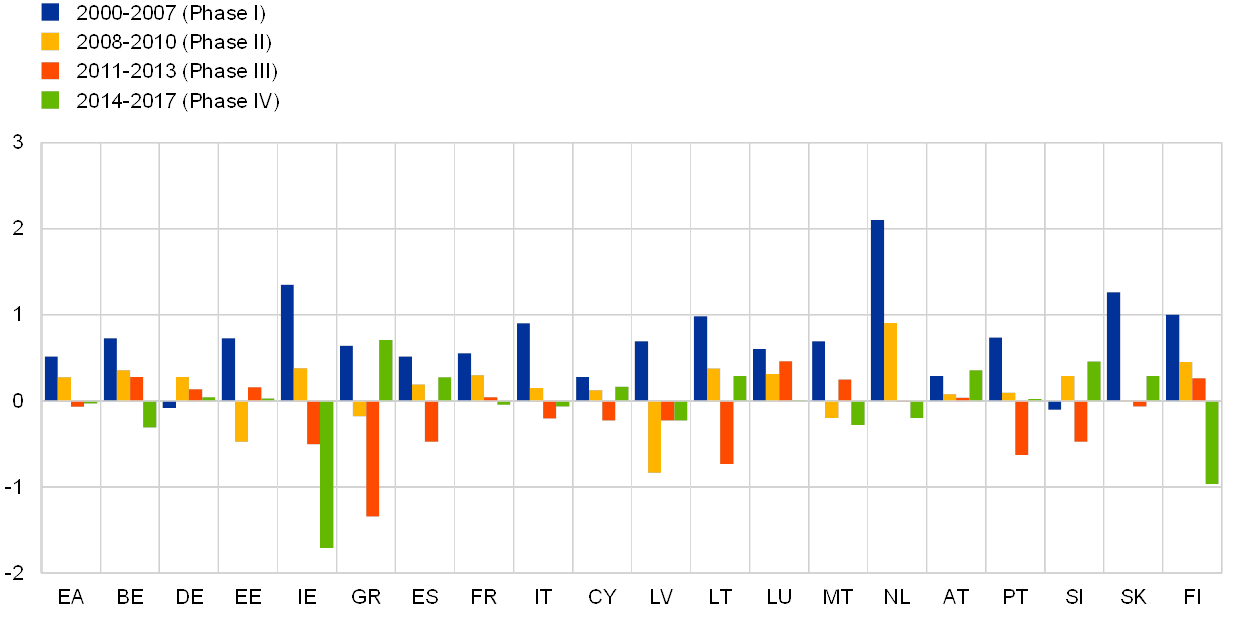
Notes: Cumulative changes in percentage points of potential GDP refer to the ratio of nominal health expenditure based on COFOG data (numerator) to nominal potential GDP (denominator) calculated using real potential GDP at 2010 reference levels (AMECO database) and the GDP deflator. Potential output estimates for Ireland are heavily influenced by the activities of large MNEs and therefore subject to a particularly high degree of uncertainty.
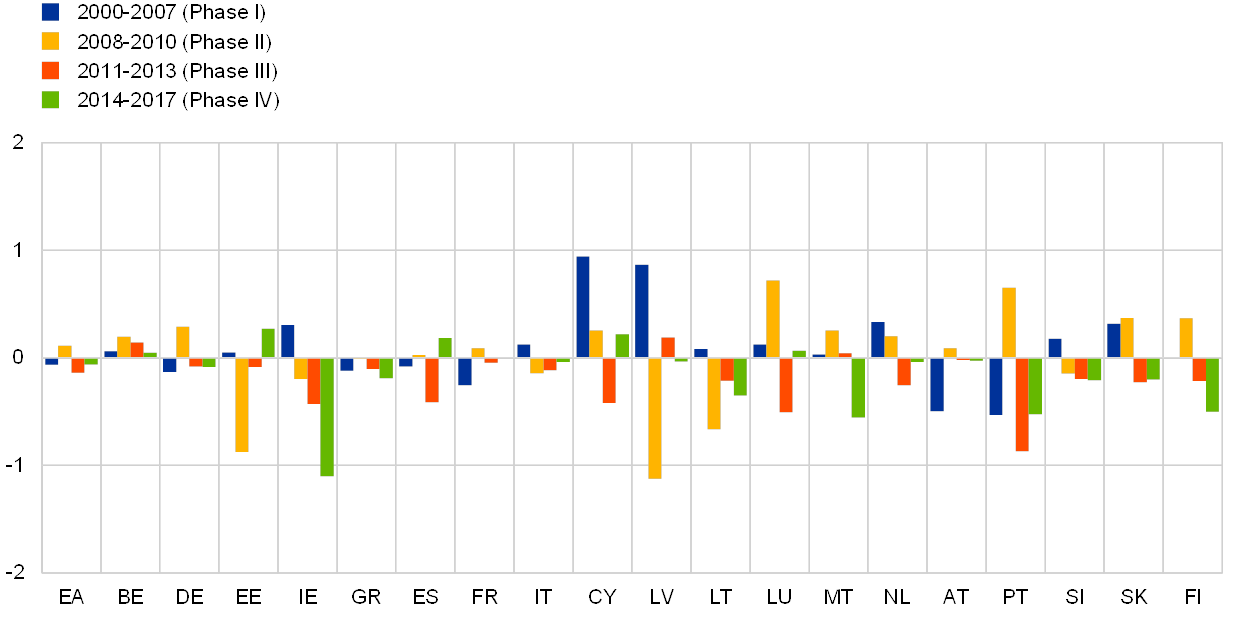
Education spending, which is generally considered to be conducive to long-term economic growth, has slowed down in a majority of euro area countries since the consolidation period. Increases in expenditure on education as a percentage of GDP were recorded before the consolidation period, mainly in Cyprus, Latvia, Ireland, Slovakia and the Netherlands (see Chart 4). During the crisis, and even more widely during the consolidation period, there was a general drop in education expenditure growth, with a number of countries recording growth rates below that of potential GDP, mainly related to cuts in compensation of employees (wages of teachers and educators). In the period 2014-2017, the dynamics of expenditure on education relative to potential GDP continued to be contained in most countries, particularly in Ireland, Malta, Portugal and Finland.
Chart 4
Government expenditure on education in euro area countries
(cumulative changes, percentage points of potential GDP)
Sources: European Commission (AMECO and Eurostat) and ECB calculations.
Notes: Cumulative changes in percentage points of potential GDP refer to the ratio of nominal education expenditure based on COFOG data (numerator) to nominal potential GDP (denominator) calculated using real potential GDP at 2010 reference levels (AMECO database) and the GDP deflator. Potential output estimates for Ireland are heavily affected by the activities of large MNEs and therefore subject to a particularly high degree of uncertainty.
Other components of social spending also show diverging trends. In particular, the behaviour of unemployment benefits is very heterogeneous across time and countries, mainly due to its economic stabilisation function. While expenditure on unemployment benefits generally increased in the pre-crisis period and in the first part of the crisis (2008-2010), it has tended to decrease since 2011. Unemployment rose significantly in most countries in the wake of the global financial crisis, but the rise in unemployment was much sharper and longer-lasting in some countries (e.g. Greece, Spain and Italy) than in others (e.g. Germany and the Netherlands). Expenditure on sickness and disability, families and children, social housing and combating social exclusion were on a decreasing trend before the crisis years (up to 2005), but have since increased steadily. This was in particular on account of expenditure related to social exclusion, such as social assistance for those at high risk of poverty or in difficult circumstances. The rest of this article focuses on analysing the three main components of social spending, namely pensions, health and education.
Box 1 Social spending and household disposable income and consumption
Government expenditure on social functions has an impact on household disposable income and consumption. Final consumption of households[11] is the total amount of goods and services bought by households for everyday use. It is the largest GDP expenditure component in the euro area (around 54% of GDP in 2018).
A large part of the social spending of government consists of social transfers to households, either in cash or in kind. Social transfers in kind can be provided in two ways: purchased market production or government output. In the former case, the government buys goods and services from market producers and provides them to individual households either free of charge or at reduced prices, such as reimbursements of healthcare costs or rent costs. In the latter case, government output is provided directly to the households, including transfers of a collective nature, such as health and education services financed and provided directly by the government. Costs related to social transfers of a collective nature include compensation of employees, consumption of fixed capital, and intermediate consumption of goods and services used to produce them. By convention, social transfers in kind are part of government final consumption.
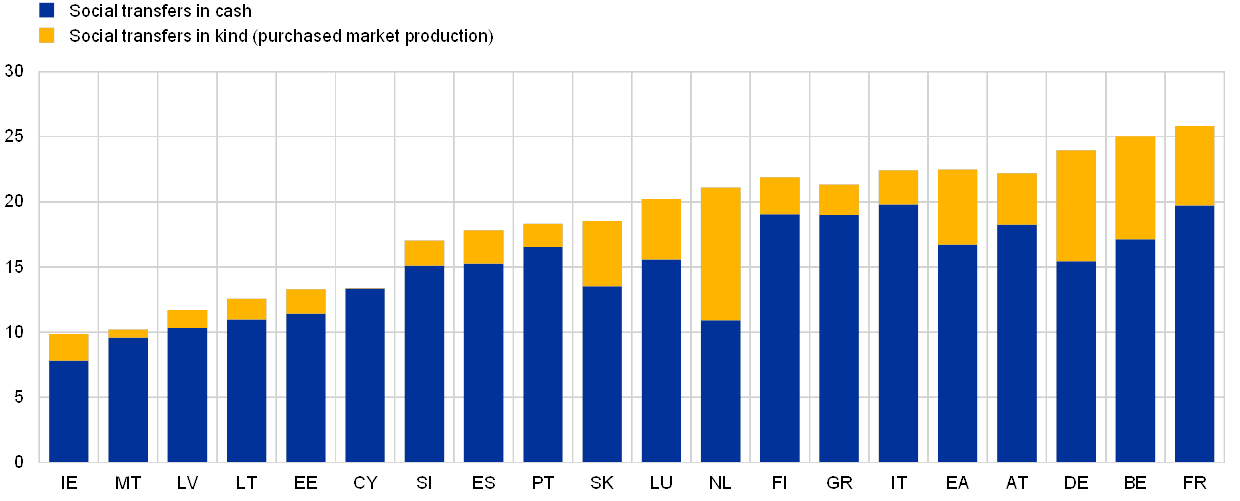
In 2017 for euro area countries, social transfers directly targeting individual households ranged between 9.9% of GDP (in Ireland) and 25.8% of GDP (in France) (see Chart A). Social transfers are mainly paid in cash (blue bars in Chart A). However, for some euro area countries (the Netherlands, Slovakia, Germany, Belgium, Luxembourg and France), social transfers in kind purchased on the market (yellow bars) represent more than one fifth of total social transfers.
Chart A
Government social transfers in cash and in kind (2017)
(percentages of GDP)
Source: Eurostat.
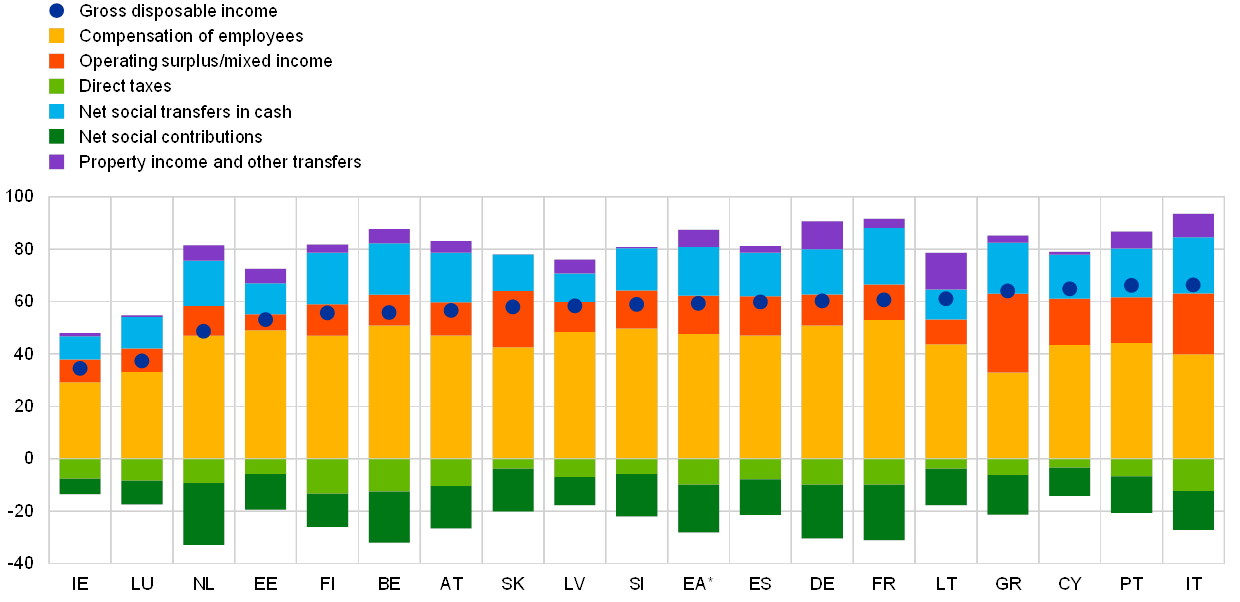
Increases in social transfers in cash directly raise household gross disposable income that can be used either for final consumption or for saving. Chart B shows the components of household disposable income as a percentage of GDP in euro area countries in 2017. In euro area countries in 2017, net social transfers in cash received by households ranged between 9% and 22% of GDP, of which the bulk was paid by government[12] (above 80% in most euro area countries). Only in the Netherlands is the share of government-paid benefits significantly lower (around 60%), owing the importance of the second (private) pension pillar for the payment of pension benefits (see Box 2).
Chart B
Household gross disposable income and its components
(percentages of GDP)
Source: Eurostat.
Notes: Data for Malta are not available.
* The euro area aggregate excludes Malta.
To adjust for the effects that the different recording practices for social transfers in cash and in kind have on household disposable income, a supplementary aggregate for the households sector (the “adjusted disposable income of households”) can be derived by adding social transfers in kind to household disposable income (for euro area countries in 2017, see Chart C). Social transfers in kind range from around 9% to 18% of GDP and boost significantly the adjusted disposable income of households. The euro area average is 14% of GDP. Payments in kind consisting of purchased market production are higher in some countries (the Netherlands, Germany, Belgium and France) than in others. This also relates to the chosen social insurance financing model (see Section 3 for different health financing schemes).
Chart C
Household gross disposable income and adjusted disposable income (2017)
(percentages of GDP)

Source: Eurostat.
Notes: Data for Malta are not available.
* The euro area aggregate excludes Malta.
3 Zooming-in on the social systems in the euro area
The social systems chosen by euro area countries, and the reforms of those systems, have an effect on government spending patterns and levels. How much countries spend on health or education reflects a wide spectrum of market, political and social factors, as well as diverse financing and organisational structures of their national systems. Cross-country comparisons of government social spending need to be interpreted with care in view of the different social systems and models that exist. This section provides an overview of the different pension, healthcare, and education systems in the euro area and how government expenditure might be affected by the choice of a particular model.
Pensions
The set-up of pension systems varies significantly across euro area countries. This can be attributed both to historical differences and to the different stages they are at in the pension system reform process. In particular, how pension systems are organised into public and private schemes has an impact on sustainability risks. In all euro area countries, government-managed pension schemes play an important role in the provision of pension benefits. In 2017, government expenditure on old age and survivors’ pensions[13] ranged from 15.1% of total government expenditure in Ireland to 33.5% in Greece (see Chart 5).
Chart 5
Government expenditure on pensions (2017)
(percentages of total government expenditure)

Source: Eurostat.
Pension systems are traditionally divided into three pillars.[14] The first pillar consists of a mandatory public social security scheme based on the pay-as-you-go (PAYG) principle. It is usually a defined-benefit scheme, but notional defined-contribution or points systems also exist in euro area countries. Such PAYG schemes often include old age, survivors’ and disability pensions. The second pillar includes social insurance schemes that are employment-related and generally set up by employers for their employees. These schemes are mainly funded, and can be either defined-benefit or defined-contribution plans. Funded and unfunded schemes for government employees are also included in the second pillar. Voluntary private schemes make up the third pillar, but are not part of social insurance.[15] These are important in countries where the government encourages such saving schemes by providing additional financial support, such as subsidies or tax incentives (e.g. Germany, Luxembourg, Italy, Malta, Austria, Portugal and Slovakia).
In addition, there may be schemes aimed at poverty alleviation that provide a basic pension or social assistance independently of employment-related contributions. These schemes are usually not part of the social insurance system, but the expenditure on these benefits may be included in pension expenditure.
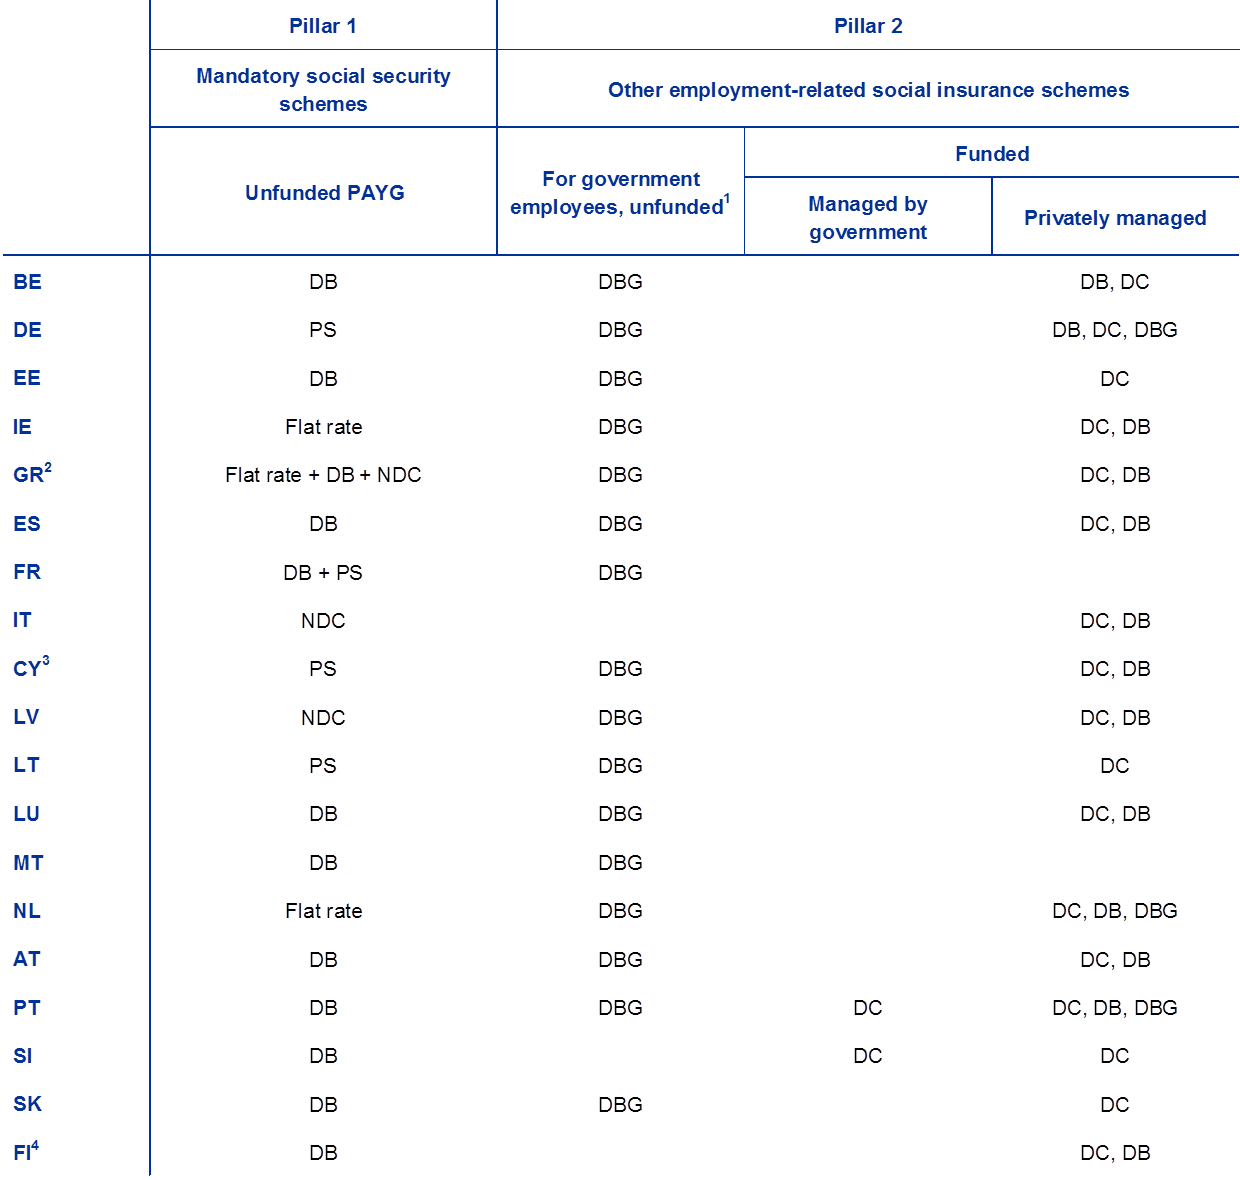
Table 2 summarises the pension schemes in euro area countries under the first and second pillars. All euro area countries have first-pillar pension schemes covering large parts of the workforce. These are by far the largest source of government expenditure on old age, survivors’ and disability pensions. In most euro area countries these schemes are defined-benefit schemes. In three countries (Ireland, Greece and the Netherlands) retirement benefits are paid at a flat rate, irrespective of the contributions or other criteria determining the level of benefits. This flat rate pension can be supplemented by other public or private schemes. A few countries also have notional defined-contribution or points systems.[16]
Table 2
First and second-pillar pension schemes in euro area countries
Sources: European System of Central Banks (ESCB); Eurostat: Pensions in National Accounts, Table 29 factsheets; European Insurance and Occupational Pensions Authority (EIOPA): Database of pension plans & products in the EEA: Statistical Summary, December 2014; European Commission (Directorate-General for Economic and Financial Affairs): The 2018 Ageing Report.
Notes: PAYG – pay-as-you-go; DB – defined-benefit; PS – points; DC – defined-contribution; NDC – notional defined-contribution; DBG – defined-benefit scheme for government employees.
1) These schemes are a cross between a government pension scheme (first pillar) and an occupational pension scheme (second pillar). For the purposes of this article, they are included in the second pillar as an employment-related scheme, but shown separately from the other schemes in that pillar.
2) The NDC in Greece is an auxiliary mandatory pension scheme.
3) The scheme (defined-benefit) for government employees covers all permanent employees hired on or before 1 October 2011.
4) The first-pillar scheme is partly funded.
In addition, the outflows from the unfunded schemes for government employees that are in place in almost all euro area countries (except Italy, Slovenia and Finland) and the funded pension schemes managed by government that exist in Portugal and Slovenia are also part of government expenditure on pensions. There are no funded employment-related pension schemes in France or Malta.
A new dataset on accrued-to-date pension entitlements in social insurance was published by Eurostat at the end of 2018. The new dataset offers information on the different pension schemes in place in EU countries (first and second pillars) at the end of 2015, and improves comparability between countries. Data are available for all euro area countries except Greece and Luxembourg. Although the data refer to the pension entitlements of households, they also illustrate the relative importance of pension schemes relating to government expenditure. Box 2 explains the new dataset and its possible uses.
Box 2 Accrued-to-date pension entitlements of households across euro area countries
Eurostat published a new comprehensive and harmonised dataset on pension entitlements in social insurance at the end of 2018.[17] The new dataset aims to establish complete and consistent coverage of social insurance pension entitlements (first and second pillars) and to ease comparability across countries.[18] It contributes to the understanding of household wealth, irrespective of how the national pension systems are organised. It also supplements information on government finances. At the same time, it should be stressed that the results are neither a direct measure of the sustainability of unfunded pension schemes nor of countries’ overall fiscal sustainability.[19] For that purpose, the concept of pension entitlements needs to be extended to also include entitlements that will be accrued in the future (implicit liabilities) as compared with future social contributions and tax payments (implicit assets).[20] At the European level, the impact of pension schemes on the sustainability of public finances is measured in the Economic Policy Committee’s Ageing Report on the basis of complex estimations of future pension contributions and benefits, as well as demographic changes.[21]
The new dataset covers pension schemes classified in the first and second pillars of the three-pillar presentation traditionally used for a comprehensive description of retirement income systems. It brings information on the second-pillar pension schemes already included in the “core” national accounts framework (ESA 2010) together with information on unfunded government pension schemes and social security pensions (first pillar). Third-pillar saving schemes are not included in the new dataset, as they are voluntary.
Table A provides an overview of the pension schemes classified on the basis of a set of criteria. First, pension schemes are split into non-general government schemes (columns A to C) and general government schemes (columns D to H), depending on the classification of the entity that retains the ultimate responsibility for any deficit in funding. The pension schemes are further broken down into defined-contribution schemes (columns A and D) and defined-benefit schemes (columns B and E to H). Pension schemes set up by general government as an employer for its own employees are grouped in columns E to G and are split into funded schemes administered either by a pension fund (column E) or by general government (column F) and unfunded schemes (column G). Unfunded national social security pension schemes are grouped in column H.
Table A
Classification of pension schemes covered by the new dataset

Pension entitlements are recorded in this table on an accrued-to-date basis. This approach takes into account pension benefits to be paid in the future to people who have already retired and to people of working age based only on the contributions they have made to date (contingent liabilities).[22]
For defined-benefit pension schemes, actuarial calculations are needed to estimate the present value of the accumulated pension entitlements. Such calculations rely on various assumptions,[23] such as the discount rate, wage growth and demographic variables, which have an impact on the final result. The choice of these assumptions has been harmonised insofar as possible across all euro area countries in order to achieve better cross-country comparability. A real discount rate of 3% (nominal discount rate of 5%) is used to estimate the present value of all future pension benefits to be paid (2015 is the base year for the first publication of this set of data). Wage growth is important because future pension benefits will generally be calculated as a share of final salary, average salary over a period of employment or lifetime earnings. The wage growth assumptions (reflecting productivity growth per capita) of the Ageing Working Group provide the basis for a harmonised approach and preserve the inevitably heterogeneous growth paths across euro area. Future life expectancy plays an equally important role, as it determines the average expected number of years the pension benefits will need to be paid. Eurostat’s most recent population projections (EUROPOP2015)[24] are used for the assumptions on future life expectancy, fertility rates, mortality rates and migration.
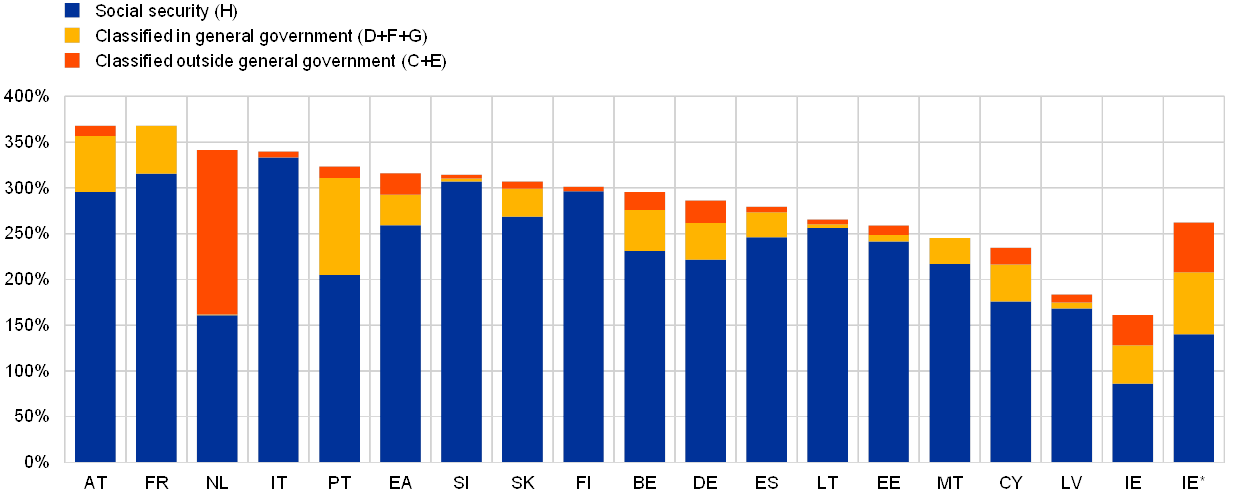
Social security pensions (column H) form the largest part of the total estimated stock of pension entitlements, ranging from 86% of 2015 GDP (in Ireland)[25] to 333% (in Italy), with most of the countries showing values of above 200% (see Chart A). Stocks accumulated in other pension schemes managed by general government (columns D+F+G) show values of up to 60% of GDP in most countries, with the exception of Portugal (106%). This category also includes pension schemes created by general government explicitly for its own employees. Italy, Slovenia and Finland have no pension schemes created by general government explicitly for its own employees. The third category consists of pension schemes not managed by general government. The stocks of pension entitlements accumulated in these schemes are limited, except in the Netherlands, where they account for more than 50% of the total stock of pension entitlements.
Chart A
Breakdown of total estimated stocks of pension entitlements (end of 2015)
(percentages of GDP)
Source: Eurostat.
Notes: Accrued-to-date pension entitlements data for Greece and Luxembourg have not yet been published and are not included in the euro area aggregates.
Two columns are shown for Ireland, in the second of which (IE*) modified gross national income is used as the denominator.
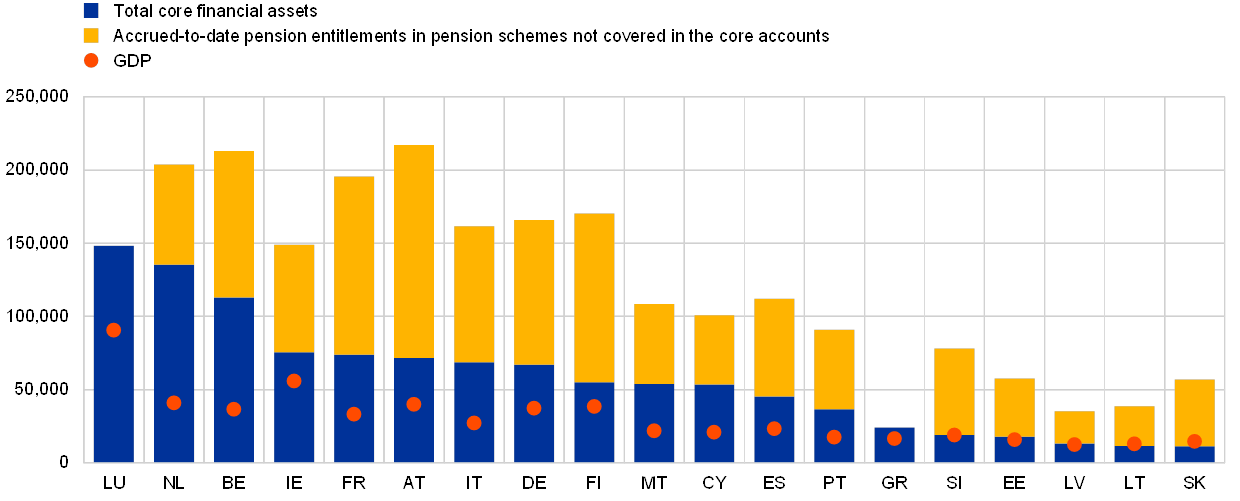
The new data can help to provide an indication of household wealth by combining total household financial wealth, as recorded and published in the core national accounts (ESA 2010), and the accumulated pension entitlements not recorded in the core national accounts (columns G and H). Financial wealth accumulated in the core national accounts and stored in various types of financial instrument – mostly deposits, debt securities, equity and employment-related pension entitlements other than social insurance (second-pillar pension schemes) – and life insurance (third-pillar pension schemes) ranges from €11,000 per capita in Slovakia to €148,000 per capita in Luxembourg.[26] Adding pension entitlements accumulated in social security schemes gives an indication of the maximum potential household wealth in euro area countries.
Chart B
Comparison of accrued-to-date social security pension entitlements and financial wealth of households (end of 2015)
(EUR per capita)
Sources: ECB and Eurostat.
Note: Accrued-to-date pension entitlements data for Greece and Luxembourg have not yet been published.
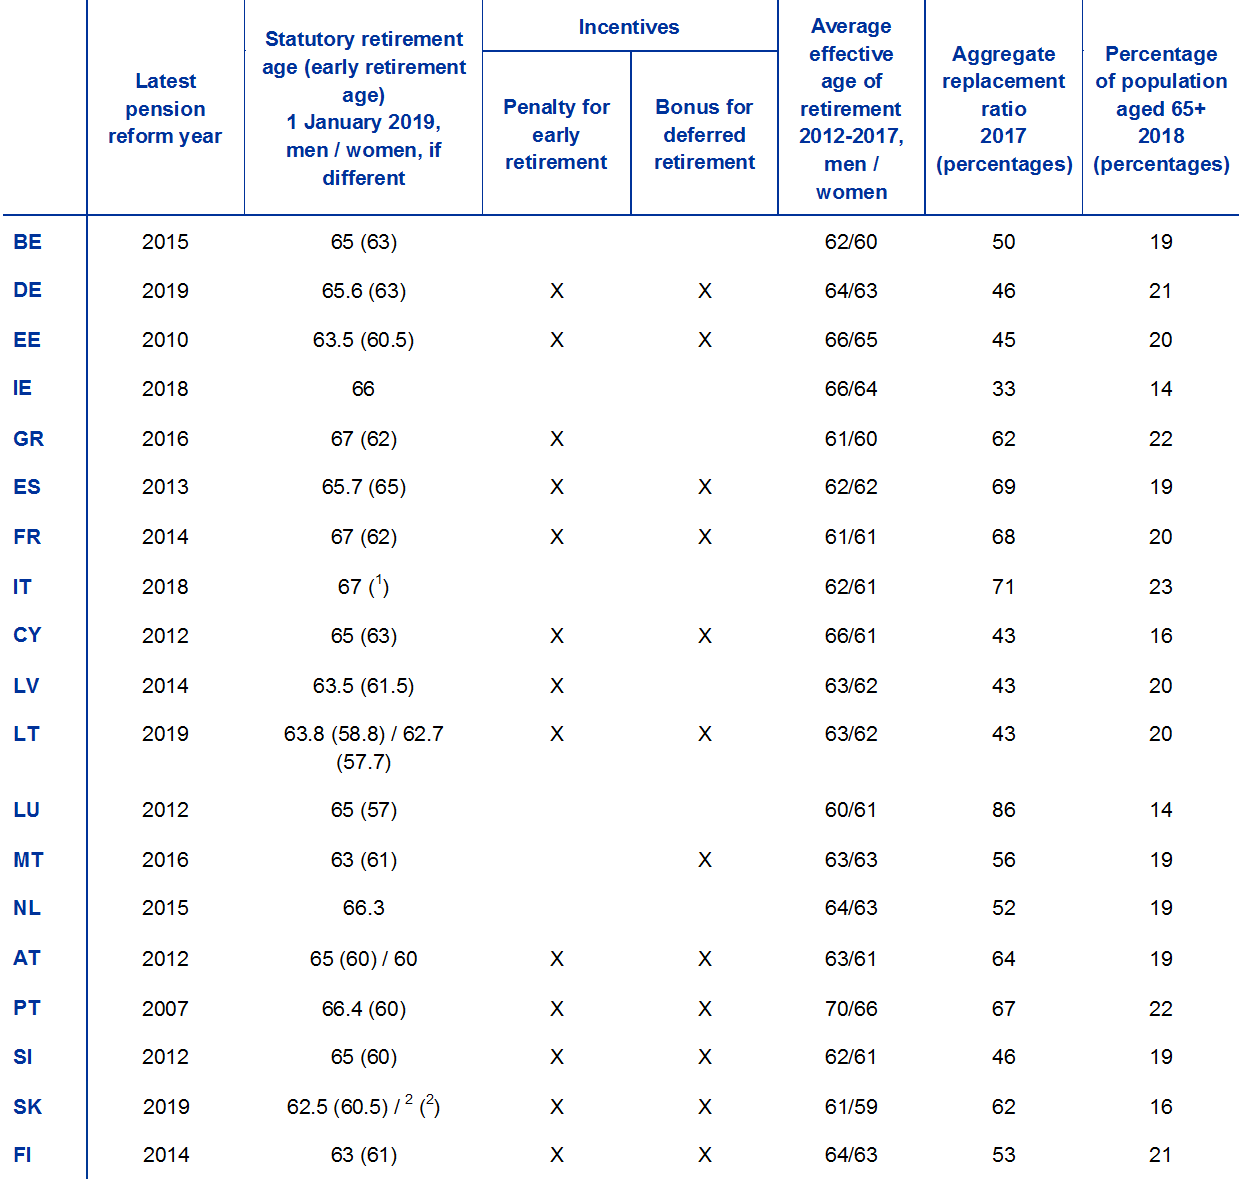
Pension reforms in a majority of euro area countries in the last decade have focused on raising the retirement age. In several countries the retirement age is linked or will be linked to changes in life expectancy (e.g. in Belgium, Estonia, Greece, Italy, Cyprus, the Netherlands, Malta, Portugal, Slovakia and Finland). Table 3 shows the statutory retirement age in euro area countries in 2019 along with the early retirement age and average effective age of retirement, which takes into account people retiring early or late. In several euro area countries the retirement age is different for men and women, but there is a trend towards equalising them in future in most countries.
Incentives for retiring earlier or later than the statutory retirement age influence the effective age of retirement. Some countries allow early retirement with full benefits once a sufficient number of years of contributions have been accumulated. In over half of euro area countries, however, early retirement results in reduced pension benefits, while there may be additional benefits for deferring retirement beyond the normal retirement age. The average effective age of retirement is below the statutory retirement age in most countries, indicating that early retirement schemes are widely used.
In addition to increases in the retirement age linked to life expectancy, there may be additional, sometimes automatic, sustainability measures built into the pension systems. Many countries apply formulae that closely link pension entitlements to the contributory career. The aggregate replacement ratios[27] in Table 3 show that the pension income from all three pension pillars replaces between 33% of working age income (in Ireland) and 86% (in Luxembourg). In Ireland and the Netherlands, a large part of the statutory state pension (first pillar) is a flat rate pension that is not related to the pre-pension income, which also explains the low shares of old age pension expenditure in total government expenditure (see Chart 5 above).[28] In the rest of the countries, the levels of pension benefits depend on the length of career and contributions made either in the whole working life or the most recent or best number of years.
Table 3
Retirement age, incentives for early/deferred retirement, income replacement ratio and proportion of population of pension age
Sources: Latest pension reform year and Statutory and early retirement age: European System of Central Banks (ESCB); Incentives: European Commission (The 2018 Ageing Report); Average effective age of retirement: OECD estimates based on the results of national labour force surveys; Aggregate replacement ratio: Eurostat (EU-SILC database); Percentage of population aged 65+: Eurostat.
Notes: The average effective age of retirement is the sum of each age of retirement weighted by the proportion of all withdrawals from the labour force occurring at that age during a five-year period. The aggregate replacement ratio is the ratio of the median individual gross pension of the 65-74 age cohort to the median individual gross earnings of the 50-59 age cohort, excluding other social benefits.
1) Early retirement is possible at any age, provided at least 43 years and 1 month (for men) or 42 years and 1 month (for women) of contributions have been accumulated.
2) The retirement age is reduced for women who have raised children, depending on the number of children.
In addition, the evolution of the benefit ratios during retirement is determined by the indexation rules. Most euro area countries apply indexation to pension benefits. This is linked to price, wage or GDP increases or a combination thereof. On the other hand, there are sustainability mechanisms to reduce pension benefits based on life expectancy at the time of retirement or on the ratio of contributions to pensions in Germany, Finland, Spain, Italy, Latvia and Portugal (see The 2018 Ageing Report[29]).
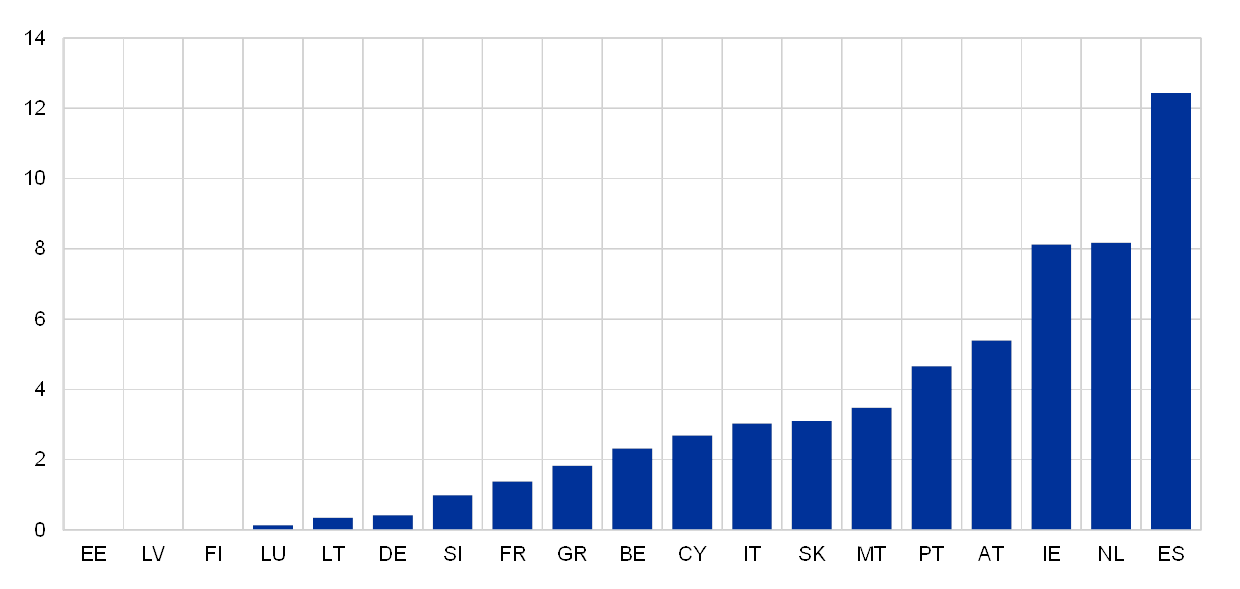
Most euro area countries also provide minimum pensions that are often income-tested or means-tested. This implies that the benefit is provided only if the person’s income or wealth is below a certain threshold. Minimum pensions are meant to alleviate the risk of poverty in old age and are part of social assistance. Among euro area countries, the highest proportion of means-tested old age pension expenditure is in Spain (12%, see Chart 6), followed by Ireland and the Netherlands (both above 8%). On the other hand, in several countries there is no means-testing (Estonia, Latvia and Finland) or very little paid out after means-testing (Luxembourg, Lithuania and Germany). However, most means-tested expenditure is related to benefits linked to social exclusion, such as social assistance payments, which are also paid beyond retirement age.
Chart 6
Expenditure on means-tested old age pensions (2016)
(percentages of total government expenditure on old age pensions)
Source: Eurostat.
Health
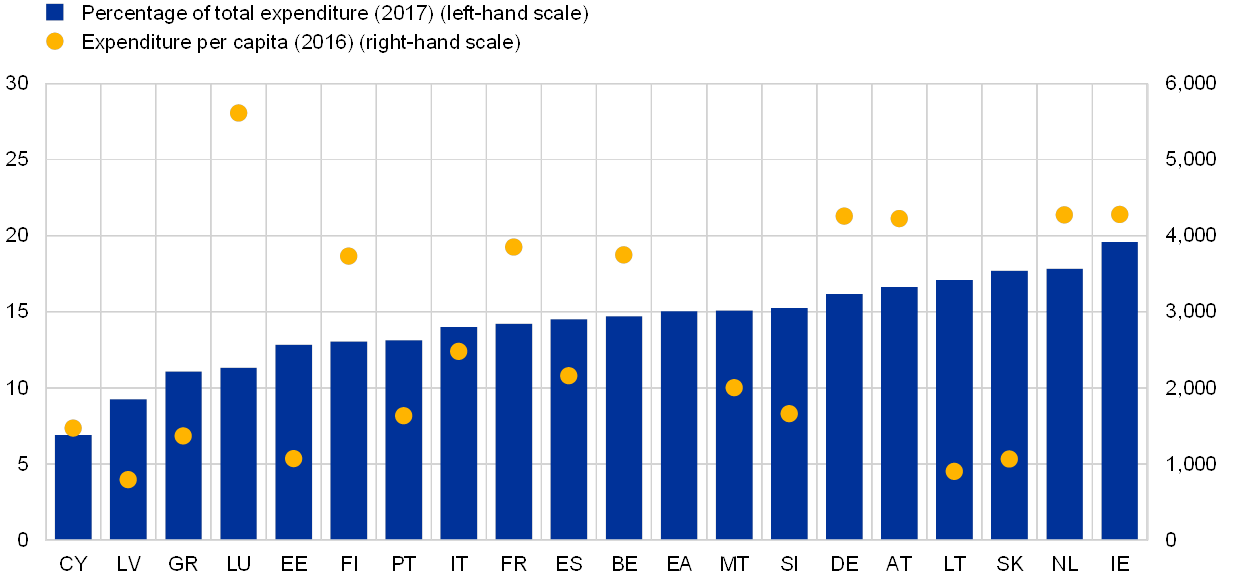
Public health expenditure is the second highest category of government expenditure in the euro area, amounting to 15% of total expenditure in 2017. It ranges from 7% in Cyprus to 20% in Ireland (Chart 7). In euro terms, the highest expenditure per capita in 2016 (over €4,000) was in Luxembourg, Germany, Austria, the Netherlands and Ireland, while it was below €1,000 per capita in Latvia and Lithuania.
Chart 7
Government expenditure on health (2017)
(left-hand scale: percentages of total government expenditure; right-hand scale: EUR per capita)
Source: Eurostat.
Note: Data per capita for Malta are for 2015.
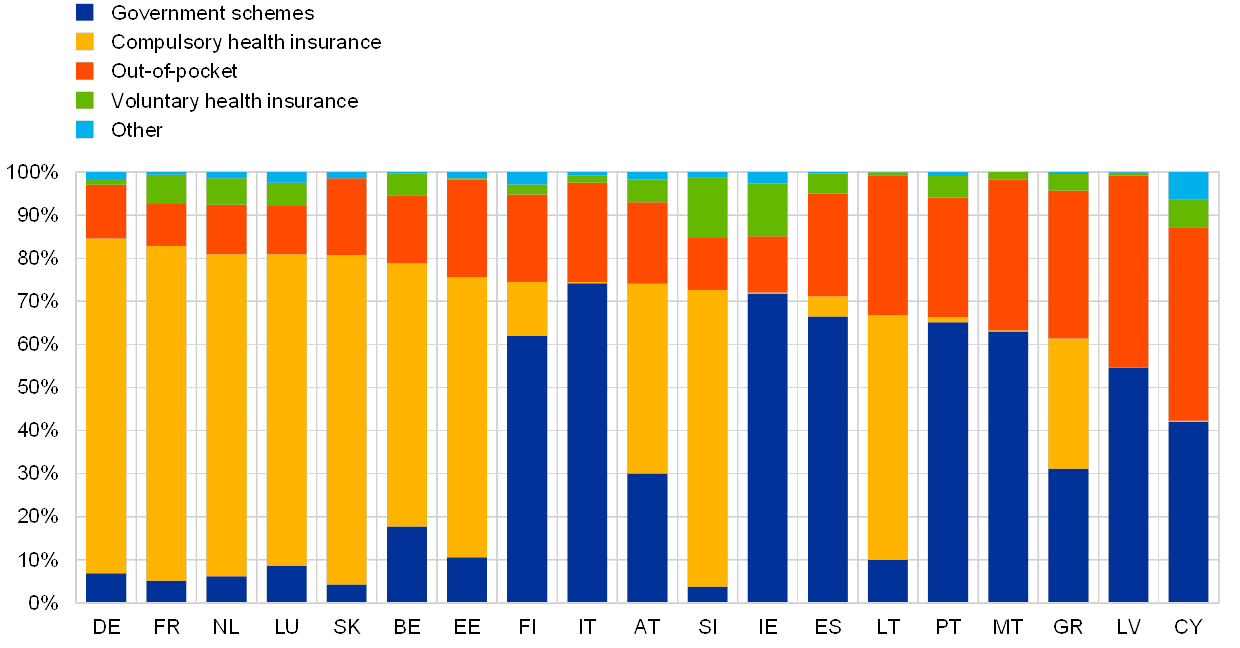
Healthcare expenditure is shared between government and households in different proportions, depending on the healthcare financing schemes in the different countries. Direct government financing is more common in countries where there is universal healthcare funded by the government. This means that health services are provided and paid for directly by the government, with hospitals managed by the government (whether owned or rented) and medical staff paid by the government. In other countries financing may be provided mainly through mandatory health insurance, where the government is not the direct provider of the healthcare services and instead buys them from private providers. Both direct government financing and mandatory health insurance are usually part of government expenditure. Government expenditure may also be complemented by private health insurance arrangements and payments directly from households (out-of-pocket expenses).
In 2016 direct government financing and mandatory health insurance accounted for over 50% of total health expenditure in all euro area countries except Cyprus (42%).[30] In about half of all euro area countries, the main financing of health expenditure was through mandatory health insurance, as shown in Chart 8 (Germany, France, the Netherlands, Luxembourg, Slovakia, Belgium, Estonia, Austria, Slovenia and Lithuania). However, in Finland, Italy, Ireland, Spain, Portugal, Malta and Latvia, direct government financing made up the majority of the health expenditure. In Greece, health financing is broadly divided among government financing, mandatory insurance and out-of-pocket expenses of households, while in Cyprus it is almost equally divided between direct government financing and out-of-pocket expenses of households. In four countries – Malta, Greece, Latvia and Cyprus – out-of-pocket expenses of households cover over one-third of health spending. In Slovenia and Ireland, voluntary health insurance finances over 10% of total health expenditure.
Chart 8
Sources of financing of health expenditure (2016)
(percentages of total)
Sources: OECD (Health at a Glance: Europe 2018); OECD Health Statistics 2018; Eurostat Database; World Health Organisation Global Health Expenditure Database.
Note: Countries are ranked by the combined share of government schemes and compulsory health insurance in current health expenditure.
Differences in healthcare financing models also have an impact on government health expenditure. Chart 9 shows the expenditure categories for government health expenditure for three groups of euro area countries – one group mainly directly government financed and two groups with mandatory health insurance financing. For the countries where health expenditure is predominantly directly financed by government (Ireland, Spain, Italy, Cyprus, Latvia, Malta, Portugal and Finland), the share of compensation of employees in total health expenditure is quite high, ranging from 30% to 55%. At the same time, the share of intermediate consumption spending, i.e. expenditure related to purchases of goods and services used in the production of final health services, is also significant (20%-37%). Social transfers related to health expenditure that are predominantly provided in kind (reimbursements of purchases of medical goods and services) are relatively low in these countries.
Chart 9
Health expenditure by category in different financing models (2017)
(percentages of total health expenditure)
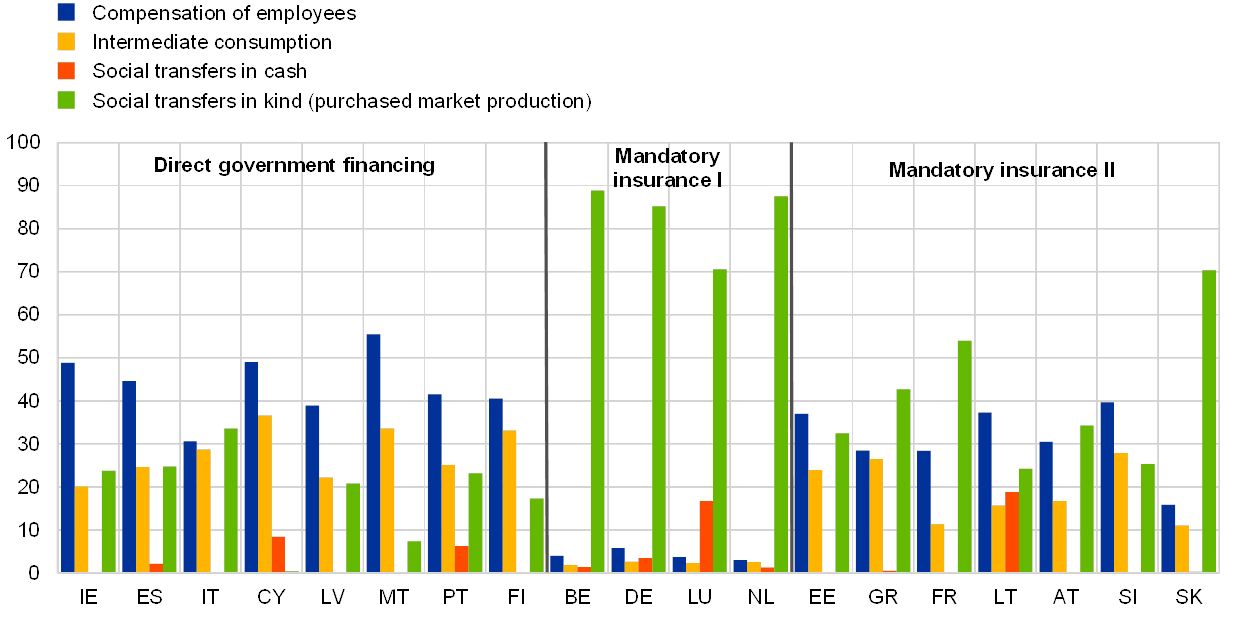
Source: Eurostat.
Note: The chart is divided into three sections: Direct government financing (health expenditure is predominantly directly financed by government); Mandatory insurance I (hospitals are not part of the government sector); Mandatory insurance II (public hospitals are part of the government sector).
The countries where the government health expenditure is financed mainly through mandatory health insurance can be distinguished according to whether public hospitals are recorded as part of the government sector for statistical purposes. The first group (Belgium, Germany, Luxembourg and the Netherlands) have a very low percentage of expenditure on compensation of employees (3%-6%) and intermediate consumption (2%-3%). These numbers are explained by the fact that hospitals, including public hospitals, are regarded as market producers, providing their services on a commercial basis. Therefore, their expenditure is not part of government expenditure on health. The largest part of the expenditure (over 70%) is in the form of social transfers in kind, composed of reimbursements and payments from health insurance companies for medical goods and services provided to households. In the second group of countries that finance government health expenditure mainly through mandatory health insurance (Estonia, Greece, France, Lithuania, Austria, Slovenia and Slovakia), the structure of health expenditure is different, as the public hospitals are part of the government sector. Thus the shares of compensation of employees (16%-40%) and intermediate consumption (11%-28%) in total health expenditure are higher than for the first group and social transfers in kind are generally lower. An exception is Slovakia, where social transfers in kind are above 70%.
Going forward, healthcare reforms may affect wages of medical and non-medical personnel, prices of medical goods and capital investment, and there may be legislated changes in targets for future healthcare expenditure.
Education
Government expenditure makes up the bulk of education spending in all euro area countries. It is complemented by private spending by organisations, other non-educational entities and households. The contribution from private expenditure is much higher in tertiary education, such as university programmes, than in lower levels of education. In Cyprus, Spain, Italy, the Netherlands and Portugal, the share of private expenditure in tertiary education exceeds 30%.[31]
In the euro area, the average share of government expenditure on education was around 10% in 2017, ranging from 7.9% in Italy to over 15% in Latvia and Cyprus (see Chart 10). The bulk of expenditure is on pre-primary, primary and secondary education, with less spent on tertiary education. This is associated with nearly full enrolment rates in primary and secondary education, due to compulsory education. But even at pre-primary level (age four and above) enrolment rates in all euro area countries are close to or above 80%.[32] In Finland and the Netherlands expenditure on tertiary education is above 3% of total government expenditure.
Chart 10
Expenditure on education by level of education (2017)
(percentages of government expenditure)
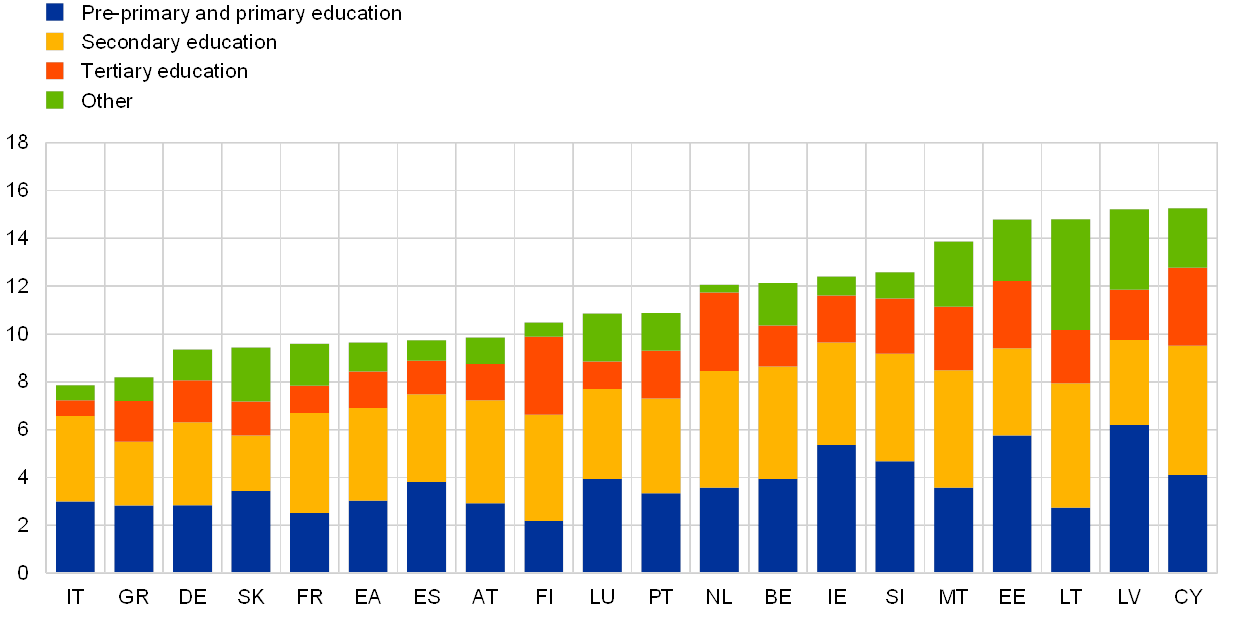
Source: Eurostat.
All euro area governments spend significant shares of total education expenditure on compensation of employees – around 60%-80%. This is in particular the wages and salaries of teachers and other teaching staff. Other large expenditure categories are intermediate consumption and investment. Social transfers play a much smaller role in education than in health and social protection, accounting for about 4.8% of total expenditure on education in the euro area.
The decline in rates of growth in education spending discussed in Section 2 may not necessarily translate fully into reduced expenditure per student, as young people constitute a declining share of the population. While Section 2 showed a clear trend towards containing expenditure in education, gains in the efficiency of growth-enhancing expenditure may nonetheless lead to better outcomes overall. Moreover, some of the countries which made the biggest cuts in expenditure on education after the financial crisis also had the biggest increases during the boom period that preceded it.
4 Conclusions
The composition and levels of social spending vary significantly across countries. The trends identified at the euro area level are heterogeneous at national level, reflecting differences in starting positions and societal preferences. Overall, countries have not converged in terms of the architecture of their social systems over the last decade. Cross-country comparisons confirm that to secure fiscal sustainability in line with the Stability and Growth Pact, while balancing economic stabilisation and equity objectives, countries need to pursue differentiated fiscal policies commensurate with the architecture of their social system. The policy guidance contained in the CSRs issued annually under the European Semester is also relevant in this context. The CSRs highlight the tailored reforms needed to tackle the key challenges in each Member State in the next 12-18 months.
Changes in euro area public expenditure since 2001 illustrate the risks that fiscal vulnerabilities pose to the sustainability of growth-friendly expenditure policies. Pension expenditure is at a historical peak in several Member States and will grow further in many countries in the absence of reforms. The ageing impact will peak when the baby-boomer generation has retired, which will be around 2040 in some euro area countries, but later in others. Countries with public PAYG pension systems will be particularly strongly affected, posing questions regarding intergenerational fairness, as the ratio of contributors to beneficiaries is shrinking and recent estimates of accrued-to-date liabilities in social security amount to more than 200% of GDP in most countries. Moreover, ageing is expected to lead to an increase in health expenditure and a decline in labour supply, growth and innovation, while precautionary savings are potentially rising.
Many countries need to build fiscal buffers, resist the tendency to reverse previous sustainability-enhancing reforms of their social security systems and undertake further reforms as needed to strengthen their national arrangements. This is particularly relevant in view of the fiscal-structural reform proposals of the CSRs for countries with already high government debt ratios and only limited fiscal space. Particular attention should be devoted to ensuring there are sufficient resources for education, as such spending has been shown to have positive effects on long-term economic growth. To safeguard sustainable health systems, further policy action will be needed to make health systems more efficient. Recommendations also call for further improvement in the targeting and efficient use of resources in all social spending categories. Additional structural reforms to increase labour force participation are also generally recommended in the CSRs.
- See the CSRs issued for individual countries on the European Commission website. The recommended reforms are aimed at boosting jobs and economic growth, while maintaining sound public finances and social fairness in euro area countries.
- See Musgrave, R.A., The Theory of Public Finance: A Study in Public Economy, McGraw Hill, New York, 1959.
- The impact of fiscal policy on the economy is not limited to discretionary fiscal policies alone. During recessions, tax receipts automatically decline and unemployment-related spending increases, while other government expenditure is largely unaffected, giving rise to “automatic fiscal stabilisers”. Such automatic stabilisers also help to support aggregate demand during downturns. Other structural or temporary fluctuations in government revenue or expenditure will also have an impact on aggregate expenditure and income.
- This definition, which includes the government functions with the largest social impact on households, is chosen for the purpose of this article. A range of definitions of social spending are in use, from a narrow one including only social transfers in cash or in kind associated with social protection, to wider definitions that also include environmental protection, housing and community amenities, and recreation, culture and religion.
- The latest available COFOG data refer to 2017. The data are in nominal terms, i.e. comparisons over time also reflect inflation differentials, and comparisons of levels across countries reflect price level differences. See “The functional composition of government spending in the European Union”, Monthly Bulletin, ECB, April 2009.
- Data on social protection, health and education expenditure are available from 2001 for the euro area and for most euro area countries.
- There is huge variation in performance and efficiency across countries, but studies tend to suggest a benchmark expenditure-to-GDP ratio of around 30-35% of GDP in advanced economies. See Afonso, A. and Schuknecht, L., “How ‘big’ should government be?”, EconPol Working Papers, No 23, European Network for Economic and Fiscal Policy Research, March 2019.
- A recent micro-simulation study suggests that the revenue cost of pension-related tax expenditure is heterogeneous, ranging from very sizeable foregone revenues in the Baltic countries and Portugal (more than 13% of old age pension expenditure), to a neutral impact in Spain and Luxembourg, and extra revenue of 1% in Malta and almost 5% of old age pension expenditure in Greece (due to the solidarity tax). See Barrios, S., Moscarola, F.C., Figari, F. and Gandullia, L., “Size and distributional pattern of pension-related tax expenditures in European countries”, JRC Working Papers on Taxation and Structural Reforms, No 06/2018, European Commission, November 2018.
- The role of pension reforms in the consolidation process and beyond, which is of special interest since these reforms might have particularly positive effects on long-term growth if they increase labour force participation, is explained in detail in Section 3.
- At the euro area level, by 2070 the proportion of people aged 65 or over is expected to rise from 20% to 29% of the population, while the proportion aged 80 or over will increase from 6% to 13%, becoming almost as large as the young population (15%). By contrast, those aged 15-64 (the working-age population) will shrink from 65% to 56%. The old-age dependency ratio (people aged 65 or above relative to those aged 15-64) is projected to increase from 30.9% to 51.8% over the period 2016-2070. See the population projections database on Eurostat’s website.
- Final consumption of households also includes an estimate of consumption of services provided by owner-occupied dwellings.
- Social transfers in cash are also paid to households by financial and non-financial corporations (e.g. second-pillar pension benefits, sickness and disability pay and family and health benefits for their employees) and by non-profit institutions serving households (NPISH).
- While in several countries disability pensions are part of the social security scheme, these data are excluded for comparability reasons, because in COFOG data disability benefits are reported together with other sickness benefits.
- Pension schemes can be classified along several dimensions. In addition to the three pillars, they can be either unfunded, where current benefits are financed by current contributions, or funded, where current contributions are invested to fund future benefits. Pension schemes can also be broken down into defined-benefit and defined-contribution schemes. In defined-benefit schemes, the benefits are determined by a formula, either alone or with a guaranteed minimum amount payable (ESA 2010 17.57). In defined-contribution schemes, the benefits are defined exclusively in terms of the level of the fund built up from the contributions and the increases in value that result from the investment of such funds (ESA 2010 17.54).
- The contributions to these saving schemes are made from disposable income of households. The benefits paid out are not part of government expenditure, but rather life insurance and annuity entitlements of households. Life insurance and annuity entitlements consist of financial claims that life insurance policy holders and beneficiaries of annuities have against corporations providing life insurance (ESA 2010 5.174).
- In points systems, benefits are determined on the basis of pension points earned on the basis of years and amounts of contributions or other criteria.
- The reporting requirements are defined in Table 29 of the ESA 2010 Transmission programme of data: “Accrued-to-date pension entitlements in social insurance”.
- The first results are published on Eurostat’s website.
- See also Mink, R., Rodríguez-Vives, M., Barredo, E. and Verrinder, J., “Reflecting pensions in National Accounts – Work of the Eurostat/ECB Task Force”, paper prepared for the 30th General Conference of the International Association for Research in Income and Wealth (IARIW), August 2008.
- See the article entitled “Entitlements of households under government pension schemes in the euro area – results on the basis of the new System of National Accounts”, Monthly Bulletin, ECB, January 2010.
- See the article entitled “The economic impact of population ageing and pension reforms”, Economic Bulletin, Issue 2, ECB, 2018.
- See Mink, R. and Rodríguez-Vives, M. (eds.), “Workshop on Pensions – 29-30 April 2009 – European Central Bank”, ECB/Eurostat, 2010.
- Detailed guidance on the assumptions to be made can be found in the ECB/Eurostat Technical Compilation Guide for Pension Data in National Accounts.
- Data and related additional information can be found on Eurostat’s website.
- The GDP of Ireland is significantly elevated by the effects of globalisation. In order to exclude such effects, modified gross national income can be used as an alternative indicator for the size of the Irish economy. The ratio of total estimated stocks of pension entitlements to modified gross national income is 262%, with stocks accumulated in social security pension schemes accounting for 140%.
- In addition, non-financial assets, such as real estate, can be used to accumulate wealth for old age. These are in particular relevant in countries with high rates of home ownership, but their impact on total wealth is not further detailed in this article.
- The ratio of income replacement from pension benefits shows how much of the income earned by a working person in the pre-retirement years is replaced by pension benefits. The replacement ratio is above 60% in Greece, Spain, France, Italy, Luxembourg, Austria, Portugal and Slovakia. The particular rules applied may determine whether pensioners will be in a higher or lower percentile of the income distribution when they retire.
- However, participation in second-pillar pension schemes is widespread and provides additional income in retirement in the Netherlands and, to lesser extent, in Ireland (see Box 2).
- “The 2018 Ageing Report – Economic & Budgetary Projections for the 28 EU Member States (2016-2070)”, Institutional Paper, No 079, European Commission, May 2018.
- See Health at a Glance: Europe 2018: State of Health in the EU Cycle, OECD/EU, November 2018.
- Joint collection of education data by the United Nations Educational, Scientific and Cultural Organisation (UNESCO) Institute for Statistics (UIS), the Organisation for Economic Co-operation and Development (OECD) and Eurostat.
- See “Education and training in the EU – facts and figures”, Eurostat, 2018.


