
Foreword

This spring saw considerable financial turbulence, with the spotlight increasingly turning on systemic risk concerns following a series of bank failures outside the euro area. While the fallout experienced by euro area banks was limited, these events have served as a powerful reminder of the importance of ensuring that banking system fundamentals are sound, in an environment where financial conditions are being tightened to tackle elevated inflation around the world.
Price stability remains as crucial as ever for durably preserving financial stability. Tighter financing conditions to forcefully address high inflation have contributed to a reappraisal of the economic outlook and to a reversal of overly-compressed asset price risk premia. As financial conditions normalise, this may expose fragilities and fault lines in the financial system. Non-bank financial intermediaries remain heavily exposed to a turning financial cycle, despite ongoing de-risking. Such turning is becoming increasingly evident in the real estate sector – in both commercial property markets, where a clear downturn is visible, and their residential counterparts, which are showing signs of correction after several years of expansion. In all of these challenges, the resilience of euro area banks has been noteworthy, but should not give way to complacency.
Recent stresses in the US and Swiss banking sectors have served as a timely reminder of just how much the preservation of financial stability depends on the shock-absorption capacity of the financial system. This is especially true for banks, which operate at the core of the system. The resilience of euro area banks is largely attributable to the strength of their capital and liquidity buffers, under stringent regulatory and supervisory oversight. Strengthening the banking union – and notably making progress on a common European deposit insurance scheme – will reinforce the ability of the euro area financial system to withstand risks going forward.
Beyond the overview of key financial stability vulnerabilities in the euro area, this issue of the Financial Stability Review (FSR) includes three special features. The first examines how interactions in market and funding liquidity can amplify stress in the financial system. The second investigates the channels through which stress in non-bank financial institutions could propagate to euro area banks. The third furthers work on identifying potential threats from climate change, with a primer on associated risks for sovereigns.
This issue of the FSR has been prepared with the involvement of the ESCB Financial Stability Committee, which assists the decision-making bodies of the ECB in the fulfilment of their tasks. The FSR promotes awareness of systemic risks among policymakers, the financial industry and the public at large, with the ultimate goal of promoting financial stability.
Luis de Guindos
Vice-President of the European Central Bank
Overview
Euro area financial stability outlook remains fragile
Euro area financial stability vulnerabilities remain elevated in the context of unexpected stress in the banking sectors of some mature economies. The recent failures of a number of US regional banks and the takeover of a Swiss bank have invited closer scrutiny of bank exposure to long-term fixed income securities, the stability of wholesale uninsured deposit funding and latent business model challenges. While the immediate cause of bank stress was related to idiosyncratic bank fragility in non-euro area economies, the episode prompted more general concerns about bank resilience in an environment of higher interest rates. This led to tensions in the bank equity and funding markets in the euro area. These tensions were short-lived, as euro area bank fundamentals remain solid and prompt regulatory intervention has contained spillovers from other economies. Nevertheless, it is possible that these events could lead to a reassessment of the profitability and liquidity outlooks for euro area banks.
Chart 1
The financial stability outlook remains fragile, with weak macroeconomic growth and a flare-up of systemic stress
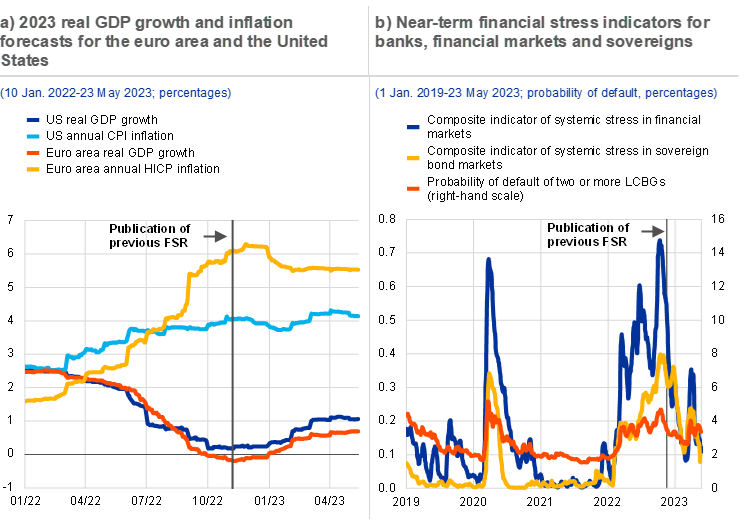
Sources: Consensus Economics, Bloomberg Finance L.P., ECB and ECB calculations.
Notes: Panel a: HICP stands for Harmonised Index of Consumer Prices; CPI stands for consumer price index. Panel b: “Probability of default of two or more LCBGs” refers to the probability of simultaneous defaults in the sample of 15 large and complex banking groups (LCBGs) over a one-year horizon. The composite indicators of systemic stress in financial markets and sovereign bond markets are contemporaneous indicators. To find out more about the composite indicator of systemic stress in financial markets, see Holló et al.* For details on the composite indicator of systemic stress in euro area sovereign bond markets, see Garcia-de-Andoain and Kremer.**
*) Holló, D., Kremer, M. and Lo Duca, M., “CISS – a composite indicator of systemic stress in the financial system”, Working Paper Series, No 1426, ECB, March 2012.
**) Garcia-de-Andoain, C. and Kremer, M., “Beyond spreads: measuring sovereign market stress in the euro area”, Working Paper Series, No 2185, ECB, October 2018.
Despite some improvement seen at the turn of the year, weak macro-financial prospects continue to pose a challenge to financial and non-financial sectors alike. Macro-financial conditions have improved slightly since the publication of the previous Financial Stability Review (Chart 1, panel a), thanks to a robust post-pandemic recovery, fading global supply chain disruptions and lower energy prices. That said, the outlook remains highly uncertain, given the presence of downside risks to growth accompanied by persistent inflationary pressures. Also, near-term financial stress indicators have picked up again (Chart 1, panel b) in the context of stress in the banking sectors of some mature economies, although they remain below pandemic and war-related levels. At the same time, there are still structural vulnerabilities in the non-bank financial intermediation (NBFI) sector in the form of liquidity mismatch and leverage. High volatility and signs of lower market liquidity are rendering financial markets and the NBFI sector prone to adverse dynamics such as forced asset sales and are increasing the likelihood of credit events materialising. Such amplification effects could tighten broader credit conditions more strongly than expected with regard to both the cost and the availability of credit, and could dampen confidence, potentially weakening the resilience of the non-financial sectors.
Financial markets and non-bank financial intermediaries remain vulnerable to disorderly adjustments
Following the rally in financial markets seen at the turn of the year, stresses in some mature economy banking sectors triggered price adjustments. Global financial markets saw an unusually robust start to 2023, driven by optimistic macroeconomic expectations predicated on the resilience of the euro area economy at the turn of the year, the faster than expected reopening of the Chinese economy and a sharp drop in energy prices. Solid corporate financial results, alongside lower volatility in interest rate markets, pushed euro area equity valuations back above historical averages (Chapter 2). The positive risk sentiment started to fade in February, following the more hawkish tone adopted by central banks globally. It reversed more abruptly in March, as unexpected stress in the US and Swiss banking sectors sent shockwaves through global financial markets.
The potential for disorderly adjustments in financial markets has risen in the context of tighter financial conditions and lower market liquidity. Renewed recession concerns in the aftermath of the banking sector stress in the United States and Switzerland have significantly lowered market-based policy rate expectations. Financial conditions have tightened as the market turmoil has led to a widening of credit risk premia in the euro area. By contrast, the fact that equity risk premia remain compressed in absolute and relative terms, especially in the United States (Chart 2, panel a), raises concerns over potential overvaluation. Equities may thus be more vulnerable to a disorderly price correction in the event of a further deterioration in the economic outlook (Chapter 2). As such, risk sentiment remains fragile and is highly sensitive to surprises as regards the outlook for inflation, growth and monetary policy in mature economies. More persistent inflationary pressures might require more significant monetary policy responses from major central banks than market participants currently expect. Among other things, a renewed surge in energy prices could also pose upside risks to inflation and could add to already-elevated volatility in interest rate markets (Chart 2, panel b). The combination of a tighter monetary policy environment and recession fears could put pressure on the valuations of riskier assets. At the same time, elevated volatility in interest rate markets has contributed to a substantial decline in market liquidity in both corporate and sovereign bond markets, leaving them more vulnerable to adverse dynamics (Chart 2, panel c and Special Feature A).
Chart 2
The risk of disorderly adjustments in financial markets remains high in an environment of high volatility and low market liquidity
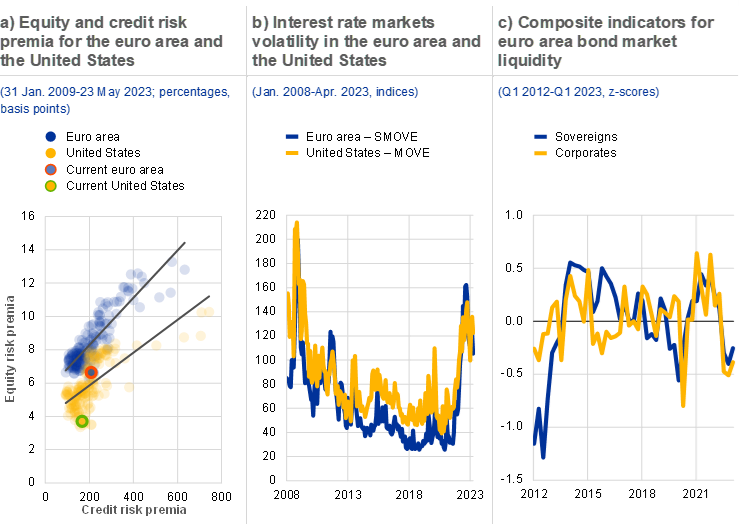
Sources: Bloomberg Finance L.P. and ECB calculations.
Notes: Panel a: equity risk premia are calculated as the five-year CAPE yield for the EURO STOXX (euro area) and S&P 500 (United States) less the five-year real (inflation swap-adjusted) government bond yield (German for the euro area); credit risk premia are calculated as the option-adjusted spread for BBB-rated corporate bonds with a residual maturity of 5-7 years. “Current” refers to the date 23 May 2023. Panel b: SMOVE is the Merrill Lynch 1M EUR Swaption Volatility Estimate Index; MOVE is the Merrill Lynch 1M UST Option Volatility Estimate Index. Panel c: for methodological details please, see Special Feature A in this issue of the Financial Stability Review
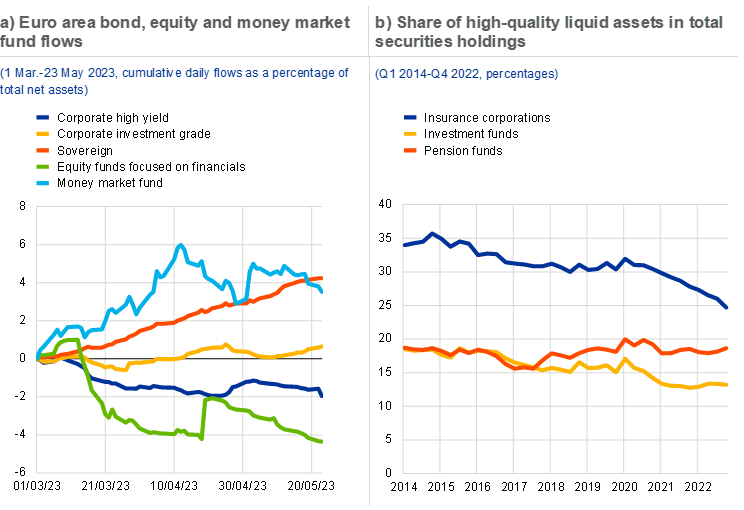
The non-bank financial sector has remained resilient during the recent banking sector stresses and market volatility, but liquidity and credit risks remain high. The highly volatile market conditions which followed the flare-up of banking sector stress in the United States and Switzerland resulted in funds which invest in European and US financials, as well as those exposed to riskier assets such as high-yield corporates, facing significant investor outflows after early March. At the same time, inflows into sovereign bond funds and money market funds accelerated (Chart 3, panel a), reflecting safe haven flows in an environment of elevated macro-financial uncertainty as well as higher rates offered compared with bank deposits. Shifts by investors towards safer fund types served to reduce aggregate credit risk in the sector (Section 4.2). Portfolio de-risking has also been evident on the balance sheets of insurance corporations and pension funds, as higher interest rates have reduced the incentives for the non-bank financial sector to search for yield. That said, overall exposures to credit risk remain high, exposing the non-bank financial sector to the risk of material losses should corporate sector fundamentals deteriorate substantially. In addition, non-banks’ exposure to property markets has increased markedly in recent years, rendering institutions vulnerable to ongoing property price corrections (Section 4.1 and Box 2). Strong links with banks, as an important source of funding for instance, could also give rise to additional vulnerabilities in the banking sector via liquidity and credit risk spillovers (Special Feature B).
Low liquid asset holdings and potential margin calls could pose the risk of possible forced asset sales, calling for enhanced liquidity preparedness. While increasing slightly in 2022, the share of high-quality liquid assets in investment funds’ securities holdings remains relatively low (Chart 3, panel b). As such, the risk remains high that, if they were to experience any sudden liquidity needs, funds could amplify adverse market dynamics via procyclical selling behaviour and forced asset sales, thereby introducing risks to wider financial stability. It is therefore necessary to strengthen existing regulatory frameworks and address issues related to structural liquidity mismatches in funds. Past stress events, such as the turmoil in March 2020 and the UK gilt market stress in the autumn of 2022, also vividly illustrate how non-banks can amplify margin call dynamics in the wider financial system, especially when coupled with excessive leverage. This highlights the importance of enhancing liquidity preparedness in the non-bank financial sector (Box 7).
Chart 3
Despite ongoing portfolio de-risking, liquidity and credit risks in the non-bank financial sector remain high in a volatile market environment
Sources: ECB, EPFR Global and ECB calculations.
Note: Panel b: high-quality liquid assets include debt securities, listed shares and investment fund shares that correspond to Level 1, Level 2A or Level 2B securities according to Commission Delegated Regulation (EU) 2015/61*, which defines liquidity requirements for banks. Shares are calculated based on market values relative to all debt securities, listed shares and investment fund shares held in the respective non-bank financial sector.
*) Commission Delegated Regulation (EU) 2015/61 of 10 October 2014 to supplement Regulation (EU) No 575/2013 of the European Parliament and the Council with regard to liquidity coverage requirement for Credit Institutions Text with EEA relevance (OJ L 11, 17.1.2015, p. 1).
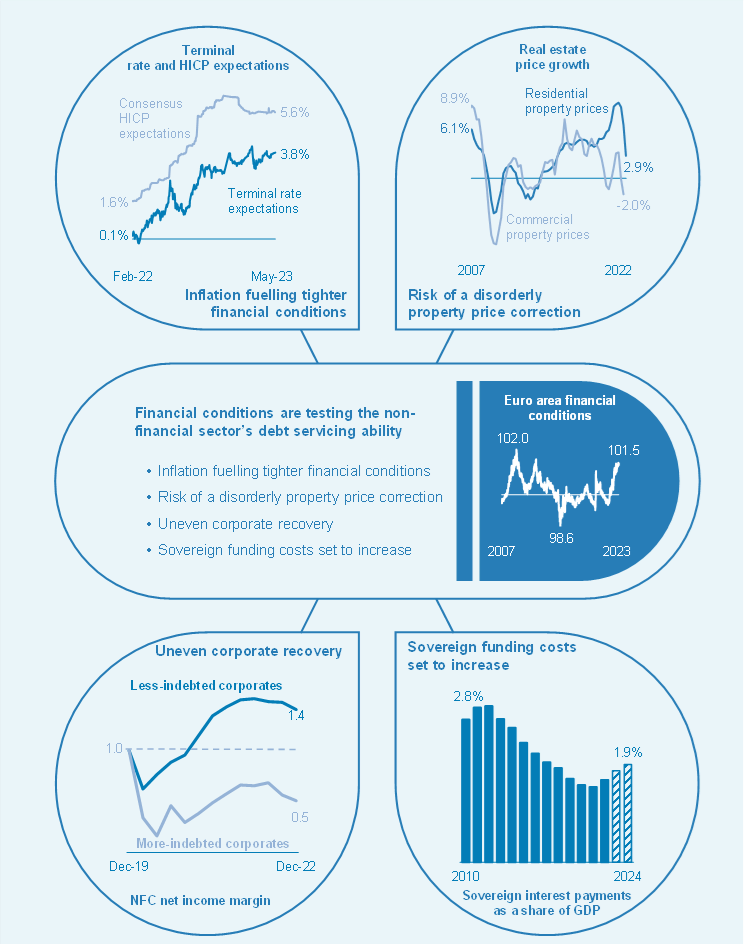
Tighter financial conditions are testing corporate, household and sovereign resilience
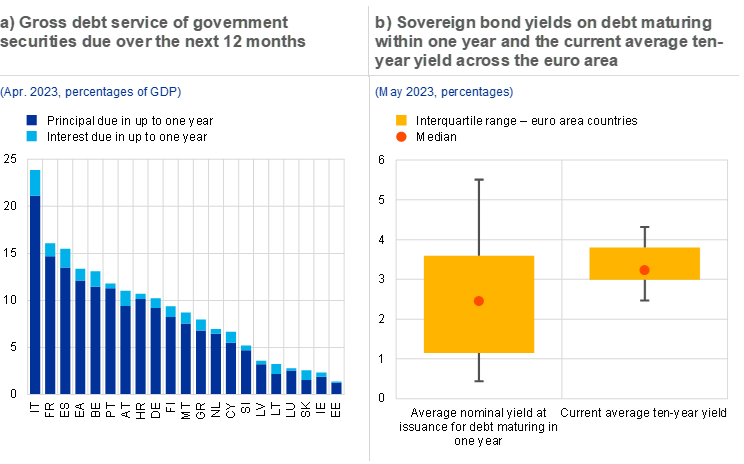
Sovereign vulnerabilities have remained elevated in a context of tightening financial conditions and weak macro-financial prospects. The pressures on public finances have eased in recent months, as the big drop in energy prices has reduced the need for additional energy-related fiscal support to be provided to corporates and households. But fiscal fundamentals remain fragile in some countries given their high debt levels, rising funding costs and high short-term refinancing needs (Chart 4, panel a). Vulnerabilities associated with potential abrupt shifts in market sentiment remain contained for now, as in recent years many sovereigns have locked in cheap financing at longer maturities. In addition, the ECB’s Transmission Protection Instrument is able to counter any unwarranted and disorderly sovereign debt market dynamics that may pose a serious threat to the transmission of monetary policy across the euro area. Foreign investors can also play a stabilising role when spreads between sovereigns become elevated, as they increase their exposures towards euro area government bond markets (Box 3). That said, interest payments are expected to increase gradually going forward, as maturing public debt is rolled over at higher interest rates (Chart 4, panel b).
Chart 4
Interest payments are set to rise gradually as maturing public debt is rolled over at higher interest rates, in particular in countries with high short-term refinancing needs
Sources: Bloomberg Finance L.P., ECB and ECB calculations.
Notes: Panel a: sovereign debt service covers all securities instruments at all original maturities with residual maturity of less than one year. Data only reflect existing maturing securities (principal and interest). Panel b: yields are averaged for the notional amount of the maturing debt.
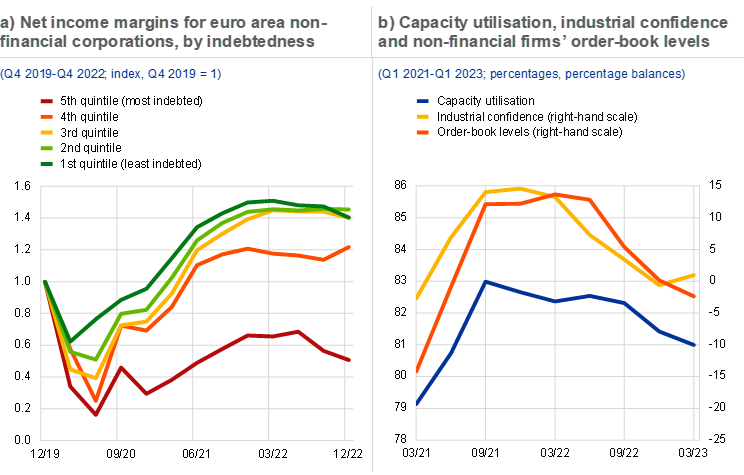
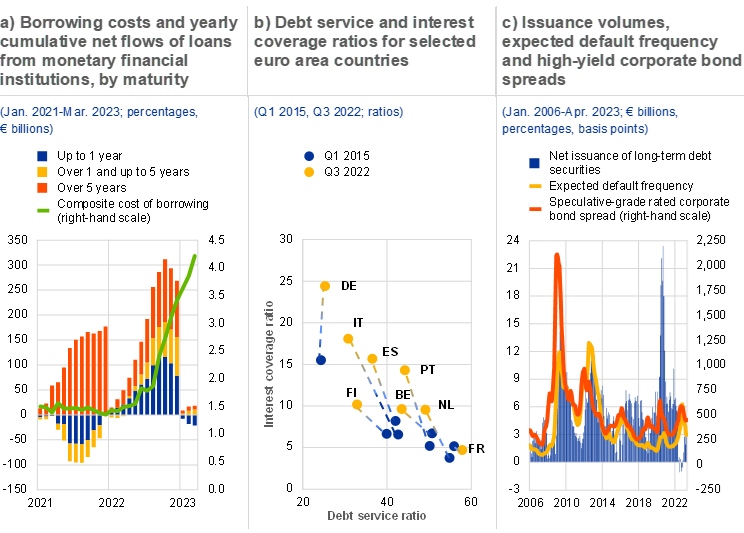
Euro area firms have benefited from high profits in the context of a sharp post-pandemic recovery and lower energy prices, but rising costs are weighing on prospects. Higher revenues and profit margins have both contributed significantly to upbeat corporate financial results. In fact, many firms have been able to raise their profit margins in sectors facing constrained supply and resurgent demand, contributing to higher wage demands and, by extension, upside risks to inflation. That said, not all firms have benefited equally from the recovery. Highly indebted, energy-intensive and/or pandemic-sensitive sectors have often been unable to increase profit margins (Chart 5, panel a), with some heterogeneity across countries. At the same time, euro area firms are facing challenges from higher refinancing costs (Box 1). There are also signs of corporates switching from market-based financing to bank loans (Box 6), given the faster pass-through of policy rate increases to investment grade corporate bond yields. Looking ahead, a combination of higher financing costs and highly uncertain business prospects will weigh on the corporate sector outlook (Chart 5, panel b). In particular, a sharper economic slowdown than currently anticipated, together with a disorderly tightening of financing conditions, could prove particularly challenging for those firms that exited the pandemic with higher debt levels, subdued earnings and low interest coverage ratios. Small and medium-sized enterprises may be particularly vulnerable to a slowdown in economic activity and higher borrowing costs, as they have benefited less from the economic recovery (Section 1.3).
Chart 5
Euro area corporates are benefiting from high profit margins, but tighter financial conditions and uncertain business prospects could prove a challenge going forward
Sources: S&P Global Market Intelligence, Bloomberg Finance L.P., European Commission, ECB and ECB calculations.
Notes: Panel a: a fixed sample of 1,099 euro area non-financial corporations with total assets in excess of €50 million as at Q4 2022. Indebtedness is based on pre-pandemic debt levels (Q4 2019).
In recent months, euro area households have benefited from lower energy prices and a resilient labour market, but higher interest rates are increasingly weighing on credit dynamics. Household confidence has recovered to some extent in recent months, in line with the marked drop in energy prices and the associated lower headline inflation outturns (Section 1.4). But households’ real incomes and consumption remain under pressure from persistently high inflation, especially for lower income buckets. The real income squeeze, coupled with higher interest rates, is increasingly compromising households’ debt servicing capacity, particularly in the consumer loan segment. On a positive note, resilient labour markets have so far supported incomes, and the shift towards more fixed-rate mortgage lending in recent years has shielded many households from the immediate impact of higher interest rates. The use of borrower-based macroprudential measures in most euro area countries in recent years has also helped to limit the build-up of risks. That said, vulnerabilities could resurface, should labour market conditions deteriorate or energy prices rise again.
The euro area property market cycle is turning, as higher interest rates weigh on affordability
The euro area residential real estate cycle has shifted into correction mode, compounding the vulnerabilities of euro area households. Euro area residential real estate markets cooled markedly in the second half of 2022. The easing of residential property price inflation is apparent in most euro area countries, in particular those (notably Germany) which were less affected during previous crises (Chart 6, panel a). Orderly price corrections might be warranted, as overvaluation measures have been signalling the potential for corrections in recent years. That said, looking ahead, a fall in prices could become disorderly as rising interest rates on new mortgage lending increasingly compromise affordability and increase the interest burden on existing mortgages, especially in countries where variable-rate mortgages predominate. This is also indicated by the record high number of banks– even more than during the global financial crisis – reporting a decline in the demand for mortgages in the first quarter of 2023. At the same time, euro area banks have tightened credit standards for mortgage loans considerably, against a backdrop of rising interest rates and deteriorating housing market prospects. The pace of prices falling could be further amplified in countries and regions where the presence of institutional investors is strong (Box 2).
Euro area commercial real estate (CRE) markets remain in a clear downturn. In an environment of tighter financing conditions and elevated macro-financial uncertainty, CRE valuations have continued to decline sharply. Demand has dropped significantly across both the office and the retail segments, with overall transaction volumes declining at a pace similar to that observed during the global financial crisis (Chart 6, panel b). The challenges associated with the current uncertain market environment are amplified by pandemic-induced structural changes, particularly in markets for lower quality assets where tenant demand has weakened since the pandemic (Section 1.5). While bankruptcies among CRE-exposed non-financial firms remain low, an even more pronounced adjustment in CRE markets could expose structural vulnerabilities in some open-ended property funds, increase credit risk for lenders and lower collateral values.
Chart 6
Higher interest rates and lower affordability have brought about a synchronous correction in residential and commercial property markets

Sources: ECB and ECB calculations.
Notes: Panel a: the countries most affected by previous crises (i.e. the global financial crisis and the euro area sovereign debt crisis) are Ireland, Greece, Spain, Italy, Cyprus, Portugal and Slovenia. Panel b: transaction volumes are based on the four-quarter moving average of the underlying total number of transactions.
Euro area banks have proven resilient to bouts of bank stress in some advanced economies
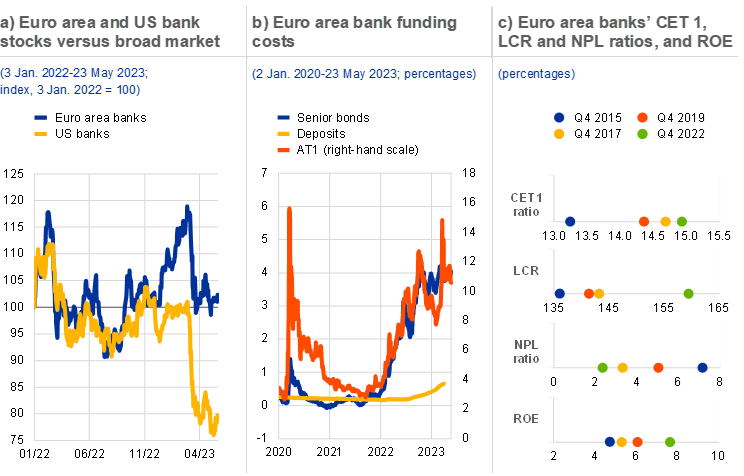
Stress in the US and Swiss banking sectors has triggered concerns over the health of parts of the banking industry, although the impact has been limited in the euro area amid solid bank fundamentals. The bullish market sentiment towards euro area banks that prevailed after the publication of the previous Financial Stability Review reversed abruptly in the first half of March (Chart 7, panel a). The failure of three medium-sized banks in the United States – Silicon Valley Bank, Signature Bank and later First Republic – as well as the takeover of Credit Suisse in Switzerland, led to broader market concerns over banks’ exposure to long-term fixed income securities, the cost and stability of deposit funding amid the growing digitalisation of banking services, business model viability and banks’ risk management practices. Euro area bank share prices fell sharply, while signs of tension became apparent in riskier bank bond markets, notably the Additional Tier 1 (AT1) segment (Chart 7, panel b), following the decision by the Swiss authorities to write down Credit Suisse Group’s AT1 instruments before its equity capital had been used up. However, given the idiosyncratic nature of the sources of US and Swiss bank stress, tensions have remained contained, and the broader implications for euro area banks have been limited. The resilience of the euro area banking sector has, in aggregate, been underpinned by strong capital and liquidity positions, and by greatly improved asset quality and profitability in recent years (Chart 7, panel c).
Chart 7
Tensions in euro area bank equity and bond markets were apparent following the US and Swiss bank stress, but euro area banks remain resilient
Sources: Bloomberg Finance L.P., S&P Dow Jones Indices LLC and/or its affiliates, Refinitiv, ECB and ECB calculations.
Notes: Panel a: euro area bank stocks are reflected by the Dow Jones EURO STOXX Banks Index and US banks stocks by the Dow Jones U.S. Banks Index; the broad market refers to the Dow Jones EURO STOXX 50 Price Index for the euro area and the Dow Jones U.S. Total Stock Market Index for the United States. Index relative to the broad market, i.e. values above (below) 100 indicate bank stocks outperforming (underperforming) the market. Panel b: deposit rates comprise rates paid to households and non-financial corporations on outstanding deposits and are weighted by their respective volume share. Yields of senior bonds comprise covered bonds, senior unsecured bonds and senior non-preferred securities, and are weighted by nominal values. AT1 stands for Additional Tier 1 capital. Panel c: CET1 stands for Common Equity Tier 1; LCR stands for liquidity coverage ratio; NPL stands for non-performing loans; ROE stands for return on equity.
Bank operating profitability improved further in 2022, but the outlook has become more uncertain amid vulnerabilities in non-financial sectors. Supported by higher interest rates and low loan loss provisions, euro area banks showed robust earnings momentum throughout 2022. This is particularly true for banks in countries where variable-rate lending predominates. While the profitability of most euro area banks has benefited from rising interest margins, uncertainties have increased around the profitability outlook. In fact, the net interest income benefits from higher interest rates could turn out to be smaller than expected, given lower interest rate expectations more recently and a catch-up in deposit rates. Also, an environment of more muted economic growth prospects, coupled with considerably tighter credit standards and a slump in credit demand, may weigh on volume growth going forward. Furthermore, some signs of increasing credit risk are already becoming evident in loan portfolios that are more sensitive to cyclical downturns, such as those with exposures to commercial real estate, SMEs and consumer loans (Section 3.4). As a result, banks may face the risk of higher provisioning costs (which tend to increase markedly around credit events), with better-capitalised banks tending to provision significantly more than banks with less capital headroom (Box 5).
The prospects of higher bank funding costs are increasing downside risks to euro area bank earnings, while a stable deposit base is limiting funding risks. Bank bond funding costs have risen markedly since the start of 2022 on account of higher interest rates and, more recently, heightened market concerns regarding banks. As such, rolling over maturing bonds will increase banks’ market funding costs going forward. Banks could also face upward pressure on their funding costs if competition for deposits were to rise and translate into faster deposit repricing (Box 4). In particular, in countries where fixed-rate loans predominate, higher funding costs make it more challenging for banks to fund low-yielding assets until maturity. That said, standard regulatory metrics suggest strong liquidity resilience overall, despite a recent decline in the funding liquidity of banks (Special Feature A). Unrealised mark-to-market losses on bond holdings are limited (Chart 8, panel a), given the relatively low share of bond holdings in total assets, and are fully reflected in regulatory liquidity ratios. Securities held at amortised cost can be used to obtain secured funding, including through ECB operations, without crystallising the valuation losses. Banks’ vulnerability to liquidity shocks is further mitigated by composition of high-quality liquid assets, which consist largely of reserves held with the ECB. In aggregate, euro area banks do not share the funding vulnerabilities which have contributed to recent US and Swiss bank failures. They are funded mainly by deposits, with retail customers providing the majority of all deposits. In addition, a relatively high share of deposits is covered by deposit guarantee schemes (Chapter 3.1).
Chart 8
While unrealised losses on bond holdings are relatively limited, interlinkages with the NBFI sector could challenge euro area banks
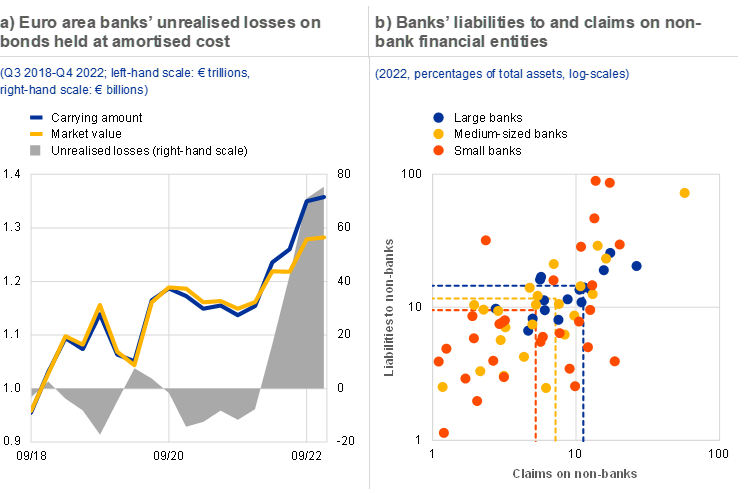
Sources: ECB and ECB calculations.
Notes: Panel a: calculated on debt securities held at amortised cost only. Where a carrying amount is not reported, nominal value is used. Unrealised losses are calculated as the carrying amount minus market values. Intra-group holdings are not accounted for. Panel b: small banks refer to banks with total assets of up to €100 billion, medium-sized banks from €100 billion to €500 billion, and large banks over €500 billion. The dashed lines represent intra-group weighted averages.
A greater need to respond to cyber and climate risks, and strong interlinkages with the NBFI sector, may also challenge euro area banks. Next to the cyclical headwinds associated with the challenging macro-financial conditions, euro area banks need to press ahead with digital transformation, not least so they can respond to the growing threat of cyber risks (Section 3.3). They also need to manage the implications of the transition to a greener economy. The results of the second ECB top-down economy-wide climate stress test suggest that, while the overall impact of the green transition is limited relative to portfolio size, it increases banks’ expected losses and provision needs in the short term (Box A in Special Feature C). In addition, elevated vulnerabilities in the NBFI sector may produce spillover risks for euro area banks, given the strong interconnections, exposing such banks to liquidity, asset price and credit risks (Special Feature B). These links appear on both sides of banks’ balance sheets and are stronger for larger banks (Chart 8, panel b).
Completion of the banking union would further enhance the resilience of the financial system
All in all, the financial stability outlook remains fragile, with stresses in the United States and Switzerland bringing banking sector vulnerabilities back into focus in an uncertain macro-financial environment. Pre-existing vulnerabilities could become more prominent and risks could spread across different sectors, should further pockets of vulnerability be revealed in the US or other banking sectors and/or macro-financial conditions worsen. The materialisation of downside risks to economic growth, more persistent inflation or a disorderly tightening of financial conditions could expose existing vulnerabilities, notably those associated with high levels of debt across the economy as well as the potential for disorderly adjustments in both financial and tangible asset markets. At the same time, shocks such as the failure to reach a political agreement on the US government debt ceiling or a further escalation of geopolitical tensions could cause these vulnerabilities to materialise, possibly simultaneously.
Preserving financial sector resilience remains key as the financial cycle turns. In the light of elevated uncertainty, involving accumulated vulnerabilities and signs of a turning financial cycle, macroprudential policy should continue to focus on ensuring that the financial system remains able to withstand adverse shocks. Existing macroprudential capital buffers should therefore be maintained to preserve the resilience of the banking sector, as the conditions for their release have not yet been met. Targeted increases in capital buffer requirements may still be considered in some countries. For example, in countries with a framework that features a positive neutral rate for the countercyclical capital buffer, the build-up of the buffer towards the neutral rate is welcome, provided that procyclical effects are avoided. Banks should, in the context of increased downside risks to economic growth and recent banking sector stresses, refrain from increasing payout ratios further, but should instead focus on preserving their existing substantial resilience. Finally, borrower-based measures under the remit of national authorities should continue to ensure sound lending standards and the sustainability of household debt, in a framework where capital-based and borrower-based measures complement each other.
The sources of US and Swiss banking sector stress have highlighted the need to complete the banking union and to further strengthen the EU bank regulatory framework. The recent banking sector stress has highlighted the need for sound corporate governance and effective risk control by banks. At the same time, it has also been a powerful reminder of the need to complete the banking union (Section 5.1), in particular the crisis management framework and a common European deposit insurance scheme. In addition, full implementation of the final Basel III elements by the agreed deadline of January 2025 is essential to ensure that banks remain well-capitalised, in order to foster trust in the EU banking system and to provide additional levers for supervisory scrutiny. ECB Banking Supervision, the Single Resolution Board and the European Banking Authority have recently reiterated the need for the consistent application of the EU’s detailed order according to which shareholders and creditors of a troubled bank should bear losses applied in past cases. This will also guide the actions of the Single Resolution Board and ECB Banking Supervision in any possible crisis interventions going forward.
Structural vulnerabilities in different parts of the non-bank financial sector require a comprehensive policy response across entities and activities. In the light of persisting vulnerabilities in the NBFI sector and the risk of renewed stress, it is critical that policy initiatives continue to be pursued as a matter of priority. The focus should be on policies that reduce liquidity mismatch in investment funds, tackle risks arising from financial and synthetic leverage across the NBFI sector and enhance liquidity preparedness across a broad range of institutions, especially in relation to margin calls. As it will take time for regulatory reforms to be agreed internationally and then implemented, the authorities regulating and supervising NBFI entities should pay close attention to vulnerabilities in the sector and should play an active role in strengthening resilience, in accordance with their mandates and existing policy frameworks (Section 5.2).
1 Macro-financial and credit environment
1.1 An improved but still fragile economic outlook
Amid high uncertainty, private sector forecasters have upgraded their baseline growth expectations for the euro area in the light of moderating energy prices. The global economic outlook seems fragile, after a period of high macro volatility, as geopolitical tensions remain high and financial conditions are tightening. At the same time, forecasters have revised euro area growth expectations for 2023 up to 0.6%, in contrast to expectations of a shallow recession of -0.1% as recently as November last year, in response to falling energy prices, China’s reopening helping to ease strains on global supply chains and labour markets remaining tight. In parallel, consensus inflation expectations for 2023 remain high (5.6% as against 5.8% in November 2022). Despite the improvement in growth prospects, risks to the outlook for economic growth remain elevated, as the distribution of expected GDP outcomes for the euro area economy in 2023 remains tilted to the downside (Chart 1.1, panel a) and inflation expectations remain high (Chart 1.1, panel b). Against the background of the stress events in the banking sector, risks to the outlook are driven predominantly by the potential for a disorderly tightening of financial conditions combined with heightened geopolitical risks.
Chart 1.1
Euro area growth expectations improve but tail risks remain elevated
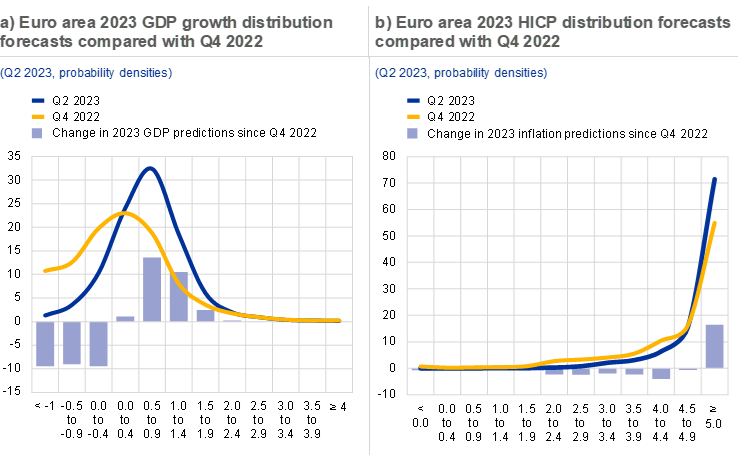
Source: ECB Survey of Professional Forecasters.
Notes: Panel a: x-axis labels reflect the year-on-year GDP growth for the euro area economy. Panel b: x-axis labels reflect the year-on-year HICP level for the euro area economy.
Easing energy prices have helped headline inflation to moderate, but risks to energy prices and inflation remain tilted to the upside. Despite a normalisation of energy prices, underlying global price inflation remains elevated and upside risks to commodity prices remain high. Tight and resilient labour markets have contributed to persistent core inflationary pressures. Moreover, measures of core inflation have continued to surprise to the upside, as the pass-through of higher costs to the services, food and industrial goods sectors is still ongoing and is likely incomplete. High geopolitical uncertainty, coupled with efforts to secure natural gas supply for the next winter season (Chapter 2) and a stronger than expected economic rebound in China, could push energy prices higher again.[1]
The global growth outlook could be derailed if there is a disorderly tightening of financial conditions while inflation remains at high levels. To ensure the timely return of inflation to their medium-term targets, central banks around the world have continued to raise their policy rates, thereby contributing to a global tightening of financial conditions. Consequently, the market pricing of the terminal rate globally, and in the euro area, has increased (Chart 1.2, panel a). Adding to tighter conditions, the recent failures of a number of US regional banks and the takeover of a Swiss bank have pushed up risk premia, including in the euro area (Chart 1.2, panel b). Moreover, changes in monetary policy expectations have resulted in the euro appreciating against a bucket of major currencies, further contributing to tighter financial conditions. Persistently elevated financial market tensions could tighten credit conditions more strongly than expected, with feedback to the broader economy, as they might impact credit availability and increase debt service costs further.
Chart 1.2
Financial conditions tighten as inflation remains high and risk perceptions increase
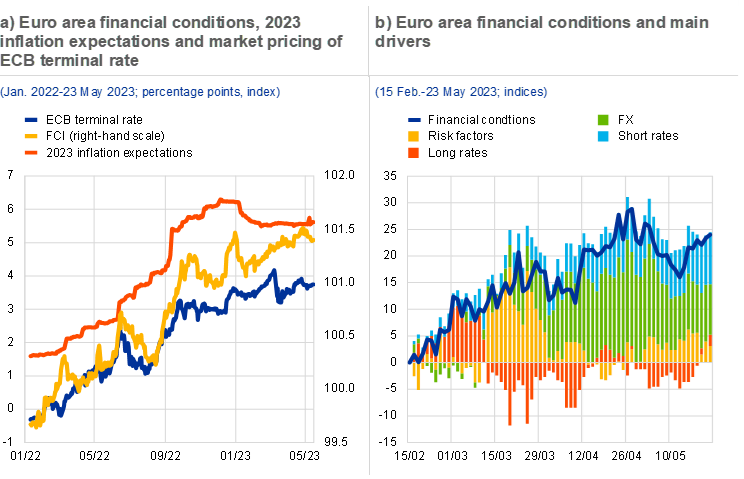
Sources: Bloomberg Finance L.P., Goldman Sachs, Consensus Economics and ECB calculations.
Notes: Panel a: terminal rate defined as the maximum of the OIS (€STR) forward curve. FCI stands for financial conditions index. Panel b: risk factors represent the sum of the category’s sovereign spreads and equities.
Globally, the failure to raise the US debt ceiling, possible side effects of China’s reopening and vulnerabilities in emerging markets are adding to downside risk and heightened uncertainty. Against the background of high political uncertainty, the inability to raise the US debt ceiling debate could spark financial market volatility and hit US growth prospects. A disorderly process could add to the risks of US sovereign debt being downgraded (Chapter 2).[2] Moreover, the reopening of the Chinese economy after pandemic lockdowns is having an ambiguous impact on global inflation levels and is adding further to uncertainty. On the one hand, it could exert upward pressure on commodity prices and global inflation levels as pent-up demand boosts consumer expenditure. On the other hand, the reopening is helping to ease supply bottlenecks.[3] Moreover, risks in China’s property market remain high, even though some improvement in conditions has been observed since the start of the year. Finally, a prudent policy stance in emerging markets is currently helping to mitigate spillovers from higher interest rates in developed economies and has kept vulnerabilities contained.[4] However, a further – or disorderly – tightening of financial conditions could leave some emerging market economies vulnerable to capital outflows and might challenge their ability to service foreign currency debt.
Against the background of high uncertainty, the risks to financial stability stemming from materialising vulnerabilities remain elevated. The drop in energy prices has relieved some pressure on inflation and has contributed to an improvement in the growth outlook. However, inflation remains high and the outlook for economic growth remains weak, with risks skewed to the downside. Moreover, after an episode of high macro volatility, global economies face renewed uncertainty from the potential financial feedback to credit availability resulting from the recent stress events in the banking sectors of some mature economies.
1.2 Fiscal positions benefit from lower energy prices, while unaddressed challenges lie ahead
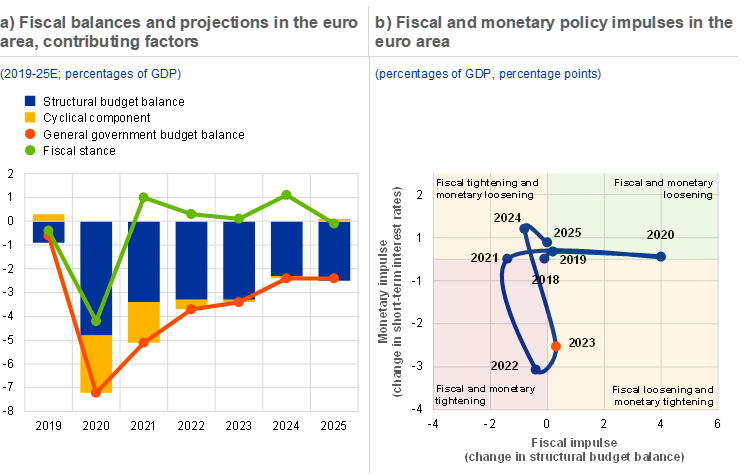
The euro area fiscal deficit is expected to decline, as lower energy prices help the fiscal outlook. The projected euro area budget deficit is expected to decline somewhat in 2023 (to 3.4% of GDP) and more significantly in 2024 (to 2.4% of GDP), before remaining unchanged in 2025 (Chart 1.3, panel a). The forecast for the euro area fiscal position is driven by the expected improvement in the cyclically adjusted primary balance, followed by an improvement in the cyclical component, while interest payments are expected to gradually increase as maturing public debt is rolled over at higher interest rates. There are significant downside risks to this outlook, however, as fiscal positions ultimately depend on inflation developments and economic uncertainty going forward. Consequently, the improvement in fiscal positions since the previous version of the Financial Stability Review will be susceptible to substantial downward revisions if risks materialise in the form of higher energy prices (Chapter 2), Next Generation EU (NGEU) absorption rates are lower than expected or the inflation outlook deteriorates significantly.
Fiscal support measures to cushion the energy price shock remain largely untargeted. Since the end of 2022, favourable energy price and inflation developments have contributed to a slight downward rescaling of fiscal support measures to about 1.8% of GDP from over 1.9% of GDP at the end of 2022.[5] At the same time, fiscal support has been revised up for some euro area countries since the previous issue of the Financial Stability Review, following the extension of measures into 2023 or updated estimates based on final budget laws. While these support measures are helping to cushion the impact of high inflation in the short term, the effect is expected to reverse in the years after 2023. Additionally, most fiscal support measures remain untargeted and are at odds with the monetary policy response to fight inflation (Chart 1.3, panel b).[6] Broad-based fiscal stimulus to aggregate demand is unwarranted and economically inefficient; this should preferably be replaced by policies that target only vulnerable cohorts of corporates and households.
Chart 1.3
Fiscal balance improves on the back of lower energy prices, but support measures might stoke inflation
Sources: ECB, ECB calculations and Bloomberg Finance L.P.
Notes: Panel a: the data refer to the aggregate general government sector of euro area countries. The fiscal stance is adjusted for the impact of NGEU grants on the revenue side. The cyclical component refers to the impact of the economic cycle and that of temporary measures implemented by governments; it includes one-off revenues and one-off capital transfers. Panel b: monetary impulse reflects the expected change in short-term interest rates as implied by the OIS (€STR) forward curve at the end of each calendar year. The impulse does not include the impact of unconventional monetary policy measures.
A favourable snowball effect, amid high inflation, has initially helped to push government debt-to-GDP ratios onto a declining trajectory. In a baseline scenario, the euro area debt-to-GDP ratio is projected to decline from 89.4% of GDP in 2023 to slightly below 87% in 2025. Nevertheless, the ratio is projected to remain above pre-pandemic levels (84%) through 2025. The expected decline is driven mainly by a favourable interest rate-growth differential (the snowball effect) stemming from high nominal GDP growth, which should more than offset foreseen refinancing needs arising from persisting, albeit decreasing, primary deficits.[7] Additionally, sovereign debt ratios have benefited from a declining real debt burden owing to first-round effects (a favourable denominator effect).[8]
In the longer term, euro area public finances would likely be negatively affected by persistently high inflation. High inflation would have an adverse impact on fiscal positions through rising interest rates that would gradually propagate to interest payments. Additionally, the detrimental impact of the energy price shock on real economic activity will have a negative effect on fiscal positions. The size of this negative effect can primarily be explained by the nature and size of the inflation shock in the euro area – mainly a large, external shock that negatively affects household balance sheets, corporate profitability and growth, and puts high pressure on nominal public spending.[9]
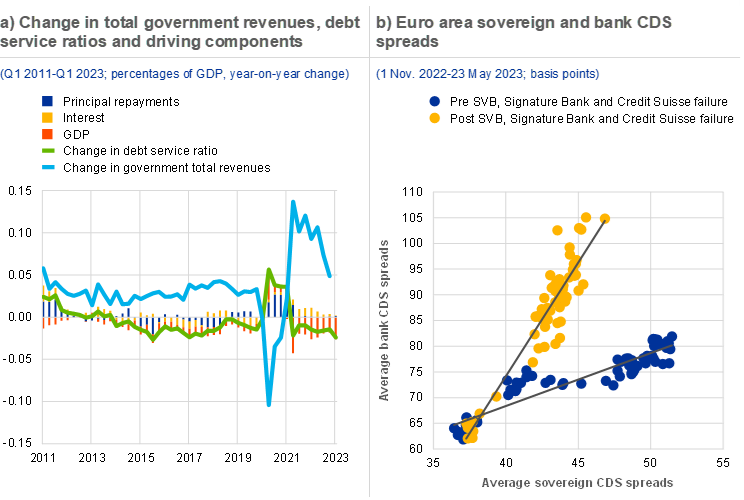
Although sovereign debt service risks have been kept in check by benign debt service conditions, they might become more challenging in the future. At present, several factors are helping debt serviceability in the short term. First, the lengthening maturity of the outstanding debt stock means that principal repayment needs are about 15% lower than they would have been for running the same amount of debt against the maturity profile in 2010. Second, although yields have been increasing, the average interest paid on outstanding government debt is still hovering around record lows for most euro area sovereigns (1.7% in March 2023), and sovereigns have continued issuing longer-term debt – despite the steep increase in funding costs. Third, higher interest payments and debt issuance have not offset nominal GDP growth, a situation which has contributed to declining debt service ratios (Chart 1.4, panel a). However, debt service ratios in some euro area countries remain high, at around 40% of GDP, and rollover risks have increased as interest rate uncertainty has added to high price volatility in sovereign bond markets (Chapter 2). A further tightening of financial conditions could spark an increase in borrowing costs for more-indebted sovereigns. This means that funding conditions could become more challenging, particularly when sovereigns need to issue high volumes of debt in volatile and shallow government bond markets.
As central bank balance sheets are reduced around the world, fiscal issuance will be increasingly absorbed by the private sector. The envisaged balance sheet run-off will reduce the market footprint of the Eurosystem, thus fostering the efficient transmission of monetary policy.[10] At the same time, the higher expected net issuance of sovereign debt this year on top of the higher free float resulting from the balance sheet run-off will need to be absorbed by the private sector.[11] This could include foreign investors, which might have a stabilising impact (Box 3), and non-banks, but also encompasses domestic banking sectors. Against this background, stress in the euro area banking sector might renew concerns over the sovereign-bank nexus. So far, the co-movement in sovereign and bank credit risk has been much more contained than in previous joint stress periods (Chart 1.4, panel b).
Chart 1.4
Debt service risk are contained, but banking stress might spark concerns over the sovereign-bank nexus
Sources: ECB, Eurostat and Bloomberg Finance L.P.
Notes: Panel a: the debt service ratio is calculated as principal and interest expenditure during the debt service period (two years) as a share of GDP. Panel b: the chart displays the average five-year CDS spreads across euro area banks and sovereigns in basis points. Pre/post failure reflects the period before/after the failures of Silicon Valley Bank, Signature Bank and Credit Suisse as of 10 March 2023.
Short-term fiscal pressures remain contained, but medium-term challenges are adding to financial stability risks. Medium and longer-term challenges are adding to sovereign vulnerabilities. Climate change is a significant source of sovereign risk (Special Feature C), and an ageing population aggravates challenges around pensions and longer-term economic growth prospects. At the current juncture, the recent stress episode in the banking sectors of some mature economies remains contained, but credit risk spillovers between sovereign and banks could lead to a reassessment of sovereign risk by market participants. The outlook for sovereigns may deteriorate if financial conditions tighten, geopolitical tensions contribute to higher commodity prices, market liquidity is low, refinancing needs are high and additional fiscal support is needed.
1.3 Corporates bank on high margins, but vulnerabilities might increase as financial conditions tighten
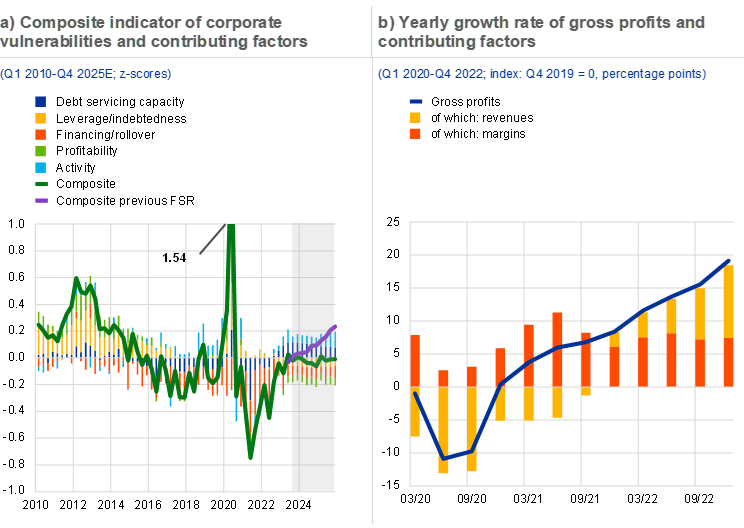
Euro area firms have benefited from a sharp post-pandemic recovery and strong profits, but business prospects are surrounded by high uncertainty. Aggregate corporate vulnerabilities remained below their long-run average for much of last year, with nominal gross profits surprisingly strong (19% above pre-pandemic levels in the fourth quarter of 2022). Despite the overall tightening of financial conditions, lower indebtedness and a high interest coverage ratio kept corporate vulnerabilities below their long-term average (Chart 1.5, panel a). Furthermore, both higher revenues and stronger profit margins contributed significantly to the corporate recovery in the second half of 2022 (Chart 1.5, panel b). These high profit margins are closely linked to high inflation prints in the euro area, as around half of the gross value-added deflator is explained by higher profit margins.[12]
Chart 1.5
Corporates benefit from burgeoning profits
Sources: ECB, Eurostat, S&P Dow Jones Indices LLC and/or its affiliates and ECB calculations.
Notes: Panel a: grey shaded area refers to the forecast. Positive values indicate higher vulnerability while negative values indicate lower vulnerability.* Panel b: profit margins are proxied by net operating surplus divided by value added. Gross nominal profits are proxied by the respective growth rate of quarterly gross operating surplus. Data are displayed as two-period moving averages.
*) For more detail on the indicator components, see the box entitled “Assessing corporate vulnerabilities in the euro area”, Financial Stability Review, ECB, November 2020.
Aggregate corporate vulnerabilities are expected to increase by less than previously anticipated, but a disorderly tightening of credit conditions is a key risk. Revisions in the forecast of the corporate vulnerability indicator since the previous edition of the Financial Stability Review mainly reflect the baseline scenario of an improving economic environment and moderating debt accumulation. At the same time, high downside risks to the economic outlook are also translating into uncertain prospects for corporates, and not all corporates have benefited equally from the economic recovery. Moreover, a disorderly tightening of financial conditions resulting from the recent stress episode in the global banking sector remains a key risk for business prospects.
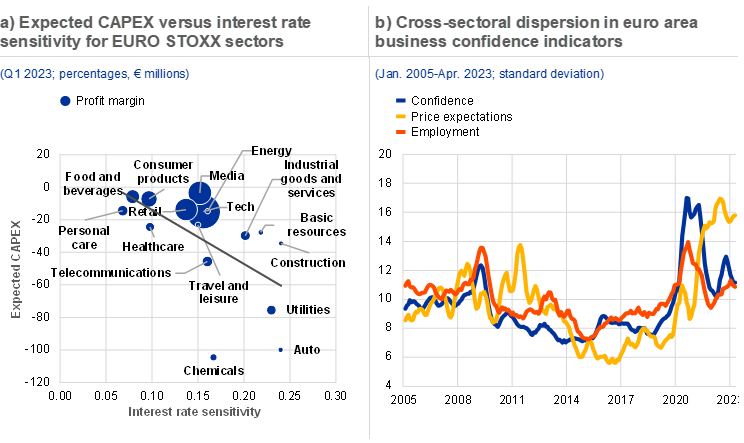
Despite the overall resilience of the corporate sector, corporate fragilities vary greatly across sectors and firm sizes. Valuations of firms with higher capital expenditure needs are more sensitive to changes in interest rates (Chart 1.6, panel a). Some of these firms might also be more vulnerable to rising borrowing costs and generally have lower interest coverage ratios (Box 1). Additionally, survey-based confidence measures indicate a large dispersion across different sectors in the euro area (Chart 1.6, panel b). In general, lower business confidence has been observed in energy-intensive sectors, while sectors that have benefited more from the post-pandemic reopening demonstrate greater confidence. Moreover, soft data from the survey on the access to finance of enterprises (SAFE) indicate that SMEs have benefited less from the rebound in economic activity.
Chart 1.6
Corporate capital expenditure is expected to drop, as economic sectors face differing prospects
Sources: ECB, Bloomberg Finance L.P., European Commission and ECB calculations.
Notes: Panel a: interest rate sensitivity is calculated as the market beta of the sector EURO STOXX sub-index to the German five-year government bond over the period from January 2015 to May 2023. Expected CAPEX reflects Bloomberg’s estimate of the amount of money a company spends to buy capital assets or upgrade its existing capital assets. A negative value reflects higher expenditure. Panel b: standard deviation across 56 NACE Rev. 2 sectors in the euro area.
Tighter financing conditions have started to have an impact on firms’ debt service costs and issuance behaviour. As financial conditions have tightened, both markets and banks have reassessed the risks surrounding corporate activity. Consequently, the cost of debt has increased sharply since mid-2022 (Chart 1.7, panel a).[13] Net lending flows fell back strongly in the first months of 2023 as it became more expensive to roll over debt, indicating deleveraging in some countries and sectors. In 2022 higher interest rates and higher working capital needs on account of high production costs also contributed to a shift from long-term lending to loans with a shorter maturity. The results of the ECB’s Q1 2023 bank lending survey indicate that the rise in the general level of interest rates, together with a decline in fixed investments, served to dampen demand for new lending. Furthermore, the impact of tighter credit standards might build up over time, with a delayed pass-through to the real activity of firms. In some euro area countries, high debt service needs are accompanied by lower interest coverage ratios, and corporates might be impacted more by the rising rate environment.
At the same time, corporate balance sheets in most euro area countries are currently healthier than they were during previous rate-hiking cycles. A long period of low interest rates and a strong post-pandemic recovery have helped the average corporate to build resilience in the face of a new downturn and rapidly rising financing costs. Gross interest coverage ratios have improved, particularly for countries which started with lower levels of interest coverage in the non-financial corporate sector (Chart 1.7, panel b). Moreover, non-financial corporate debt levels declined to 144% of gross value added in the fourth quarter of 2022, compared with 148% before the pandemic.
Chart 1.7
Corporates have built resilience, but borrowing costs are increasing strongly and bankruptcies have picked up in some euro area countries
Sources: ECB, Eurostat, Bank for International Settlements. Moody’s Analytics, Refinitiv and ECB calculations.
Notes: Panel b: the debt service ratio is defined as the ratio of interest payments plus amortisations to income. As such, it provides a flow-to-flow comparison – the flow of debt service payments divided by the flow of income.* The interest coverage ratio is defined as the ratio of gross operating surplus to gross interest payments before the calculation of financial intermediation services indirectly measured.
*) See “How much income is used for debt payments? A new database for debt service ratios”, BIS Quarterly Review, Bank for International Settlements, September 2015.
Bankruptcies in some euro area countries have started to increase from a very low base, although they remain below pre-pandemic levels. Bankruptcies in most large euro area economies remain below pre-pandemic averages, although they have now started to normalise from the low levels reached during the pandemic.[14] Moreover, forward-looking measures for default risk signal elevated risk (Chart 1.7, panel c), driven by those sectors directly impacted by the energy crisis such as transport and industry.
Corporate vulnerabilities might be higher than the aggregate suggests, as not every corporate benefited equally from the post-pandemic recovery. The uneven impact of two succeeding, and distinctly different, crises has introduced considerable diversity over the cross-section of firms and might imply that an economic recession could have more severe consequences for financial stability than this aggregate picture suggests. Furthermore, the predominance of variable-rate lending in some countries, together with high corporate debt levels by historical and international standards, renders some corporates vulnerable to a further or disorderly tightening of financial conditions. Moreover, debt instruments that are more sensitive to rate increases, such as leveraged loans, might be particularly exposed should financial conditions tighten further. As such, there could be more defaults going forward, with potential knock-on effects on bank balance sheets and household employment prospects.
Box 1
Corporate vulnerabilities and the risks of lower growth and higher rates
Following a strong post-pandemic recovery in profits, euro area non-financial corporations are now facing the risk of stagnating economic activity combined with tightening financial conditions. As monetary policy normalises, interest rates on corporate bonds and loans are increasing at their fastest pace in decades, leading to declining corporate lending and investment. Against this backdrop, this box uses firm-level balance sheet data to identify vulnerable non-financial corporations (NFCs) based on the Altman Z-score, a measure of insolvency risk.[15]
More1.4 A resilient household sector is facing tightening financial conditions
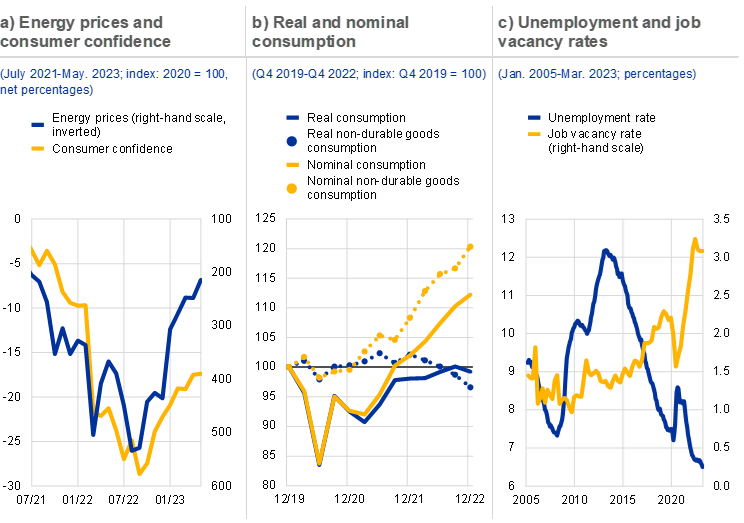
Euro area households have benefited from the improvement in economic conditions, despite elevated uncertainty and the impact of persistent inflation. While households remain worried about their future economic situation, consumer sentiment improved somewhat as energy prices started to decline at the end of 2022. This helped to ease upward pressure on headline inflation and make it more likely that a recession would be avoided in 2023 (Chart 1.8, panel a). Nevertheless, stubbornly high inflation continues to weigh on households’ real disposable incomes. This led to a decline in real household consumption in the fourth quarter of 2022 (Chart 1.8, panel b).
Strong labour markets have provided constant support to household resilience. The unemployment rate in the euro area remained at historic lows of around 6.6% throughout the end of 2022 and start of 2023, while the job vacancy rate reached an all-time high of over 3% (Chart 1.8, panel c). This situation benefits household incomes and suggests that a significant reduction in labour demand would be needed to cause a large increase in unemployment.
Chart 1.8
Real household consumption in the euro area is being squeezed by inflation, but households are benefiting from strong labour markets
Sources: European Commission, Hamburg Institute of International Economics (HWWI), Eurostat and ECB calculations.
Notes: Panel b: non-durable goods consumption is aggregated across those euro area countries for which the breakdown of consumption across different classes of goods and services is available. They account for roughly 80% of total euro area private consumption. Non-durable goods consumption refers to the consumption of goods that can be used only once or that have a lifetime of considerably less than one year (including energy and food). Panel c: the latest data for the job vacancy rate refer to Q4 2022.
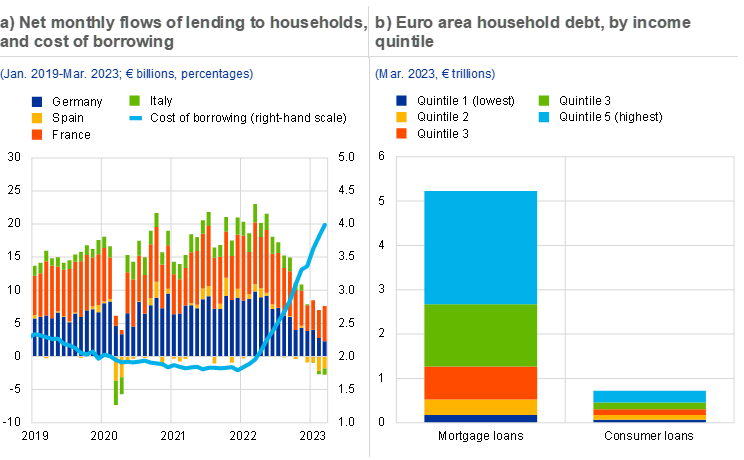
Tightening financial conditions have led to a turn in household borrowing, particularly for interest rate-sensitive items. Interest rates on household loans increased to 4% in March 2023, up by 2 percentage points year on year and marking the fastest increase since the euro was introduced. This resulted in a marked deceleration to 2.8% in the annual growth of lending to households, down by over 1.5 percentage points over the same period, driven predominantly by a contraction in demand for new mortgage loans (Section 1.5). While the annual growth in loan volumes has remained positive, net loan flows have turned negative in some euro area countries since the end of 2022, meaning that more loans were repaid than new loans were issued (Chart 1.9, panel a). As interest rates rise and banks signal their intention to continue tightening credit standards, lending volumes are likely to decline further – possibly resulting in a deleveraging of the household sector.
The debt servicing capacity of some households may be challenged by tightening financial conditions. Households in many countries continue to be shielded from immediate increases in the interest burden on their outstanding debt as a high share of loans have been issued with longer interest rate fixation periods over the last decade. This trend has reversed somewhat since the second half of 2022, particularly in countries where the relative pricing of variable-rate and fixed-rate loans has changed. Households in these countries are therefore more exposed to a repricing of outstanding debt over the short term. Some households may fall into distress as the purchasing power of their incomes continues to decline and credit standards are, as expected, tightened further. At the current juncture, households at the lower end of the income distribution are the most vulnerable as they are disproportionally affected by high inflation. Wider risks to financial stability appear contained, however, as households in some countries have experienced a significant deleveraging since the global financial crisis across the income distribution and, in particular, in the lowest income cohorts. Moreover, these households account for only a small share of overall household borrowing (Chart 1.9, panel b).[16]
Chart 1.9
New household borrowing is declining, but vulnerable households hold only a low share of overall household debt
Sources: ECB and ECB calculations.
Notes: Panel a: financial transactions (flows), monetary financial institutions excluding ESCB reporting sector. Data are working-day and seasonally adjusted. Panel b: shares of loans held by income quintiles are forward-extrapolated from the ECB’s 2017 Household Finance and Consumption Survey and are multiplied by outstanding loans.
While vulnerabilities among households have increased further, risks still appear moderate. Although net wealth growth has moderated significantly, aggregate household balance sheets remain resilient and may benefit from deleveraging going forward. Households’ real incomes and consumption, while under pressure from persistently elevated inflation, are supported by the continued strength of labour markets and fiscal measures. Nonetheless, some vulnerable households may face difficulties servicing their debt, as reflected in an increase in consumer loans classified by banks as suffering a significant deterioration in credit quality (Chapter 3). Such vulnerabilities could worsen, in particular if labour market conditions deteriorate or energy prices rise again significantly. Moreover, housing markets have started to cool in most euro area countries, and price developments could weigh on consumer sentiment going forward (Section 1.5). In the medium term, vulnerabilities could be exposed and debt servicing capacity could deteriorate, especially in countries where residential properties remain overvalued, debt levels are elevated and household debt is mainly at variable rates. That said, such an adverse scenario currently remains a tail risk.
1.5 Vulnerable real estate markets are turning
Both mortgage loan origination and house prices have slowed significantly amid higher interest rates. The average interest rate on loans for house purchase in the euro area stood at 3.4% in March 2023, almost 2 percentage points higher than it had been a year earlier. This steep rise in borrowing costs has led to a significant decline in loan origination. While the volume of new lending was higher during the first half of 2022 than in previous years, it declined markedly in the second half of the year and fell again sharply at the beginning of 2023 (Chart 1.10, panel a). Residential real estate (RRE) prices in some euro area countries or market segments also started declining in the second half of 2022. This fall could become more pronounced as higher interest rates reduce mortgage affordability (Chart 1.10, panel b). In the ECB’s latest bank lending survey, banks reported a further substantial net tightening of credit standards for housing loans and a strong net decline in loan demand in the first quarter of 2023. They expect credit standards for mortgages to tighten further, and net loan demand to decline further, in the second quarter of the year as well, although to a lesser extent than during the first quarter. In other words, the trends observed in new lending and house prices at the end of 2022 are expected to continue in 2023.
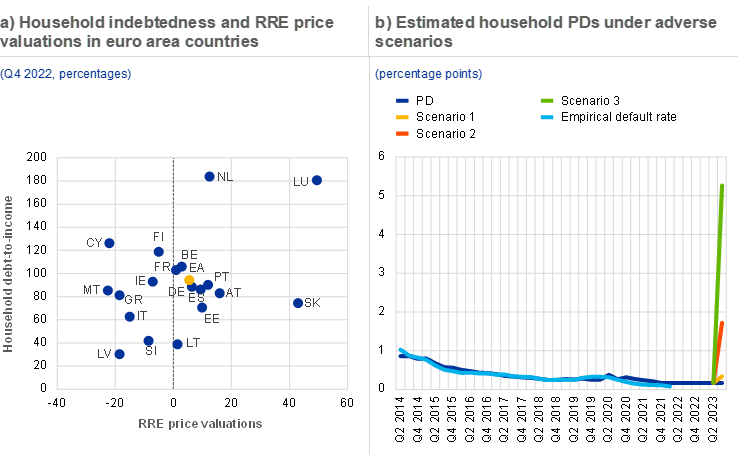
A combination of stretched valuations, high debt and interest rate sensitivity in some euro area countries could amplify system-wide losses should an adverse scenario materialise. The rapid growth in RRE prices over the last few years has led to stretched valuations in some euro area countries, as house price dynamics have exceeded their fundamentals. In some euro area countries, the estimates of house price overvaluation in the fourth quarter of 2022 exceed 10%, increasing the risk of a price correction. At the same time, household indebtedness has remained high, increasing the risk of defaults or lower consumption in the event of adverse shocks, such as a significant increase in unemployment. However, these vulnerabilities vary across euro area countries (Chart 1.11, panel a). In countries where fixed-rate mortgages predominate, rising interest rates will mainly have a negative impact on the demand for new loans in the short term, while they will also push up household debt burdens in countries with a large share of variable-rate mortgages.
Chart 1.10
The housing cycle is turning, as new lending volumes and housing prices decline
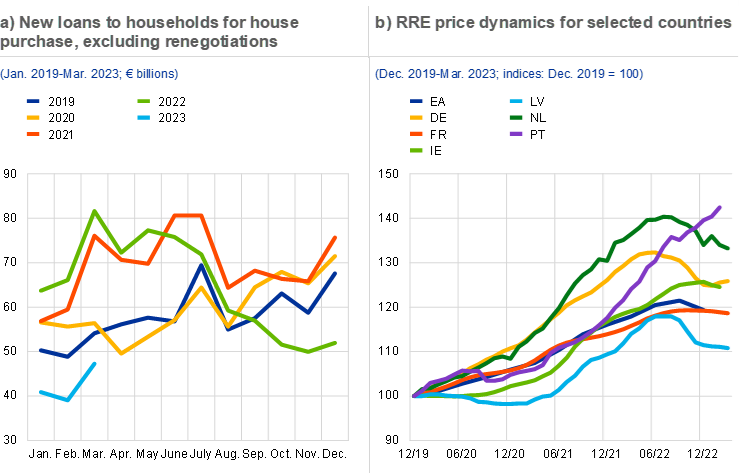
Sources: ECB, Europace (Germany), Statistics Netherlands, Central Statistics Office (Ireland), Confidencial Imobiliário (sourced from BIS, Portugal), Arco Real Estate (Latvia), meilleursagents.com (France), Eurostat (euro area) and ECB calculations.
Notes: Panel b: data show developments in house price levels for euro area countries for which higher frequency data are available. For Germany, France, Latvia and Portugal, these data are not obtained from national statistical offices and might only reflect price developments for some segments of the RRE market. The data for Portugal show much stronger growth than the official data, the latter covering the universe of housing transactions. Similarly, the data included in the chart for Latvia reflect only changes in prices for standard apartments in the secondary market. The euro area index, which covers the universe of housing transactions in all euro area countries, is included in the chart as a reference despite being available only until end-December 2022.
Default rates on household mortgages are likely to rise in the event of an economic downturn, although a severe increase remains a tail risk. Simulations using loan-level data from securitised mortgage loans show that rising mortgage rates alone are unlikely to trigger a significant increase in defaults on mortgages. Estimated probabilities of default (PDs) for mortgages exhibit a moderate increase (around 0.2 percentage points) when considering only the impact of higher interest rates. By contrast, estimated PDs increase much more (by up to 5 percentage points) when considering different scenarios combining higher interest rates with higher unemployment, lower house prices and lower disposable incomes (Chart 1.11, panel b). The more severe scenarios remain a tail risk, as households have generally benefited from favourable labour market conditions and borrower-based macroprudential policy measures, and the increasing share of fixed-rate mortgages has made borrowers more resilient in many countries over recent years.
Chart 1.11
Accumulated RRE vulnerabilities are elevated in some euro area countries and could amplify losses in an adverse scenario
Sources: ECB, European DataWarehouse GmbH and ECB calculations.
Notes: Panel a: the latest data point available is used for countries for which Q4 2022 data are not available. The average valuation estimate is the simple average of the price-to-income ratio and an estimated Bayesian vector autoregression model. For details of the methodology, see the boxes entitled “Tools for detecting a possible misalignment of residential property prices from fundamentals”, Financial Stability Review, ECB, June 2011, and “A model-based valuation metric for residential property markets”, Financial Stability Review, ECB, November 2015. The measures of overvaluation used in the chart can be found in the ECB’s Statistical Data Warehouse. Overall, estimates from the valuation models are subject to considerable uncertainty and should be interpreted with caution. Alternative valuation measures can point to lower/higher estimates of overvaluation. Panel b: the estimations are based on securitised loan data available for Belgium, Spain, France, Ireland, Italy, the Netherlands and Portugal. As the chart uses information on securitised mortgage loans alone (potentially resulting in selection bias), it might not be an accurate reflection of national mortgage markets. PDs are estimated using data on the stock of loans reported in the database with reference date end-2020. The scenarios considered are as follows: Scenario 1: interest rates rising by 200 basis points from March 2023 level (baseline PD uses end-2021 interest rates); Scenario 2: interest rates rising by 150 basis points, RRE prices falling by 10%, real incomes falling by 10% and unemployment rates rising by 4 percentage points; Scenario 3: interest rates rising by 200 basis points, RRE prices falling by 15%, real incomes falling by 15% and unemployment rates rising by 6 percentage points.
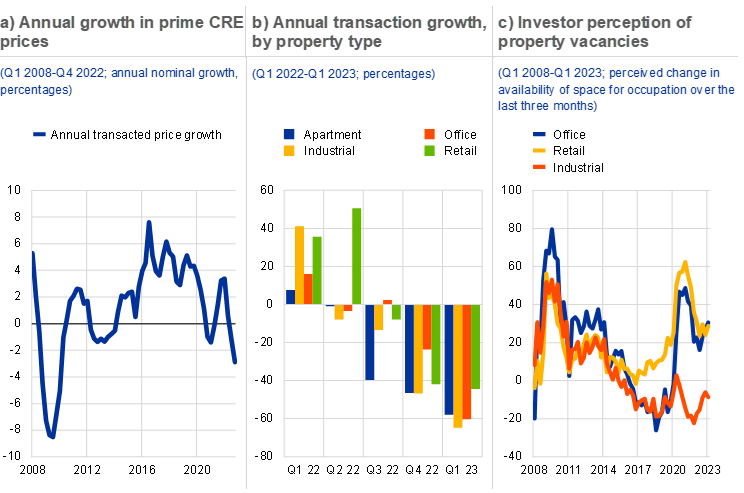
Commercial real estate (CRE) markets are suffering a clear downturn, with declining prices, falling investor demand and residual vulnerabilities persisting from the pandemic. Price growth in CRE markets fell sharply into negative territory at the end of 2022 (Chart 1.12, panel a). This was accompanied by a sharp drop in market activity, with 39% fewer transactions in euro area CRE markets in the fourth quarter of 2022 compared with a year earlier. This pace of decline is similar to that observed during the global financial crisis.[17] Unlike during the pandemic, this contraction in investor demand applies across all types of CRE assets, as investors in every segment are facing rising financing costs and macro-financial uncertainty (Chart 1.12, panel b). In addition, the impact of the current market environment may be amplified by vulnerabilities arising from structural changes in CRE markets. While market intelligence indicates that vacancy rates in euro area CRE markets are substantially lower than in the United States, tenant demand in the retail and office segments has not fully recovered from the pandemic, with vacancy rate indicators remaining substantially above pre-pandemic levels (Chart 1.12, panel c). Market intelligence indicates that these structural vulnerabilities are clustered in markets for lower quality CRE assets, as hybrid working and ESG concerns are concentrating investor and tenant demand in prime markets. More widely, flows to real estate funds have been slowing steadily, raising the risk of liquidity events among euro area real estate funds, especially in those countries where open-ended real estate funds dominate (Section 4.2).[18]
Chart 1.12
Prices and investor demand are falling across CRE markets, while structural vulnerabilities arising from the pandemic remain
Sources: ECB, RCA, RICS and ECB calculations.
Note: Panel b: data show the annual growth in euro area market transaction numbers. Note that the “Apartment” segment reflects purchases of large residential assets as shown in the RCA database. This will not include purchases of residential buildings by households, for example.
The speed and depth of the turn in euro area real estate markets will determine the potential for stress on the financial system, notably so if the correction turns disorderly. Affordability and demand in housing markets have decreased as financial conditions have tightened – thus far in an orderly manner for real estate markets which had seen considerable growth in previous years. Risks remain tilted to the downside, especially in those countries where debt levels are elevated and properties might be overvalued. The commercial segment has seen a steeper downturn, as the changing macro-financial environment compounds structural vulnerabilities that arose from the pandemic. A pronounced correction in real estate markets could have an adverse effect on the wider financial system and the real economy. Stress among institutional investors, who have seen marked increases in exposures to real estate, could amplify any correction in real estate markets (Box 2), while the construction sector could suffer in the event of a pronounced decline in demand for new houses.[19] At the same time, as banks have tightened financial conditions mainly in the light of their higher risk perceptions – with funding costs or balance sheet constraints playing a smaller role – macroprudential policy measures might still allow resilience to be enhanced in the banking sector without having procyclical effects (Chapter 5).
Box 2
Institutional investors and house price growth
The presence of institutional investors, particularly investment funds, in euro area residential real estate (RRE) markets has increased markedly in recent years. This growth may be attributed to a range of factors, including persistent flows into riskier asset classes such as real estate over the prolonged period of low interest rates (Chart A, panel a).[20] Yet the implications for housing markets, as well as for financial stability more broadly, remain largely unstudied. This issue is becoming more pressing as the real estate cycle turns and as rising interest rates reverse the dynamics of flows into real estate funds. It also raises concerns that vulnerabilities in the investment fund sector may amplify any real estate market correction.[21] This box provides an initial empirical examination of the role of institutional investors in euro area RRE markets and the possible implications for financial stability.
More2 Financial markets
2.1 Inflation persistence might trigger renewed market corrections
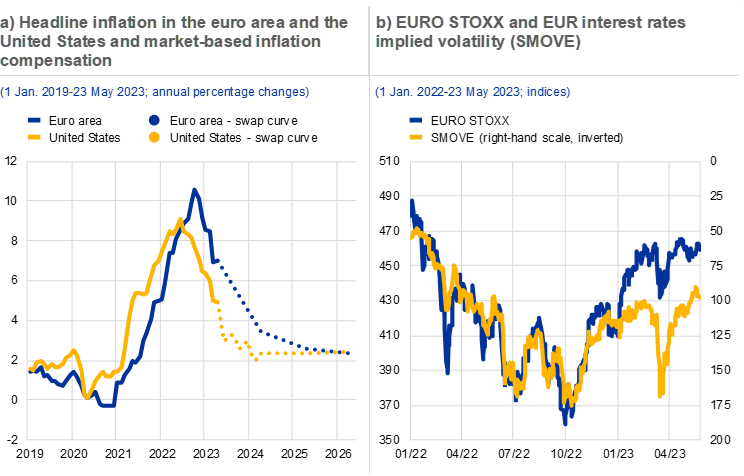
Elevated volatility in interest rate markets continues to weigh on wider financial market dynamics and may reveal both cyclical and structural vulnerabilities in the financial system. Rising inflation and market participants’ concerns that the major central banks could tighten monetary policy significantly in response were among the main drivers of the market correction seen in 2022. More recently, however, falling energy prices and the easing of supply chain bottlenecks have led to market expectations of a relatively rapid decline in inflation (Chart 2.1, panel a). This contributed to a decrease in implied rate volatility and, together with a stronger outlook for growth (Chapter 1), supported a substantial rebound of risky-asset valuations until early March (Chart 2.1, panel b). In contrast to 2022, the subsequent jump in volatility was related to banking sector stress in some mature economies combined with renewed recession fears. Looking forward, continued large swings in policy rate expectations may lead to a further deterioration of market liquidity conditions (Special Feature A) and may also challenge the liquidity preparedness of non-bank financial intermediaries with significant interest-rate derivative exposures (Chapter 4, Chapter 5 and Box 7).
Chart 2.1
Inflation expectations and interest rates volatility remain important drivers of market dynamics
Sources: Bloomberg Finance L.P. and ECB calculations.
Notes: Panel a: market-based inflation compensation based on euro area one-year, two-year and three-year HICP inflation swap rates and 1M-11M, one-year, two-year and three-year US CPI inflation swap rates. Panel b: SMOVE is the Merrill Lynch 1M EUR Swaption Volatility Estimate Index.
Inflation persistence could put pressure on risky-asset valuations. The stress in the banking sectors of some mature economies following the failure of Silicon Valley Bank has resulted in a substantial decline in market-based interest rate expectations, especially in the United States (Chart 2.2, panel a). Growing risk aversion has led some market participants to rebalance their portfolios towards safer assets, thereby pushing risk-free rates lower. In addition, investors have concluded that the stress might result in banks further tightening credit conditions (Chapter 3), which could have a disinflationary impact and might, therefore, also be relevant for monetary policy. However, if inflation remains at elevated levels, market expectations for future interest rates might be revised upwards once again. A combination of a tighter policy environment and renewed recession fears could put pressure on risky-asset valuations. Therefore, markets remain sensitive to inflation data, albeit to a lesser extent recently, as evidenced by short-term implied volatility which increases around CPI publication dates (Chart 2.2, panel b).
Chart 2.2
Inflation persistence might lead to a substantial jump in market volatility
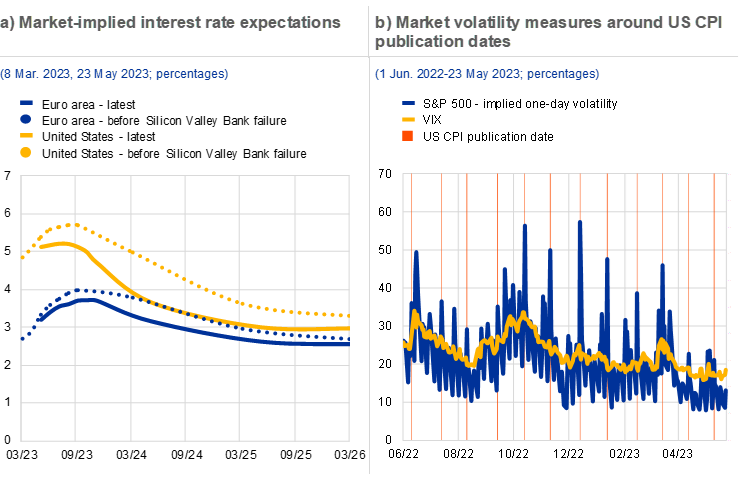
Sources: Bloomberg Finance L.P. and ECB calculations.
Notes: Panel a: market expectations are based on the €STR OIS and the USD SOFR OIS implied forward one-month rates, which might also include a term premium component. Data before the failure of Silicon Valley Bank refer to 8 March 2023. Panel b: VIX refers to the Cboe Volatility Index. Implied one-day volatility is calculated as the average annualised one-day volatility implied from the last close prices of put and call options on the S&P 500, with a delta parameter of around 50% and one day to expiry.
A rebound in energy prices would pose upside risks to the inflation outlook and could also add to market volatility. Since Russia began to cut supplies of natural gas to the EU in 2021, futures prices for this commodity have had a strong influence on both short-term and medium-term market-based inflation expectations (Chart 2.3, panel a). Lower gas consumption, increased imports from other countries and an unusually warm winter have caused natural gas prices to fall significantly from their August 2022 peak. Although the futures curve does not suggest that prices are expected to rise greatly in the coming months, there is still a high level of uncertainty in this market. Securing natural gas supply for next winter may push prices substantially higher, given that China’s reopening will probably result in increased competition for the LNG deliveries that Europe is now more reliant on.[22] The growing upside risk to natural gas prices is reflected in the increasing skewness of option-implied volatility (Chart 2.3, panel b). Another jump in prices could lead to more persistent inflation and weaker growth, potentially precipitating renewed market corrections. Furthermore, increased volatility in commodity derivatives markets would again increase the liquidity needs of energy market participants at a time when access to funding might be challenging.[23]
Chart 2.3
Potential rebound in gas prices might worsen the inflation and growth outlook again, with spillovers to financial markets
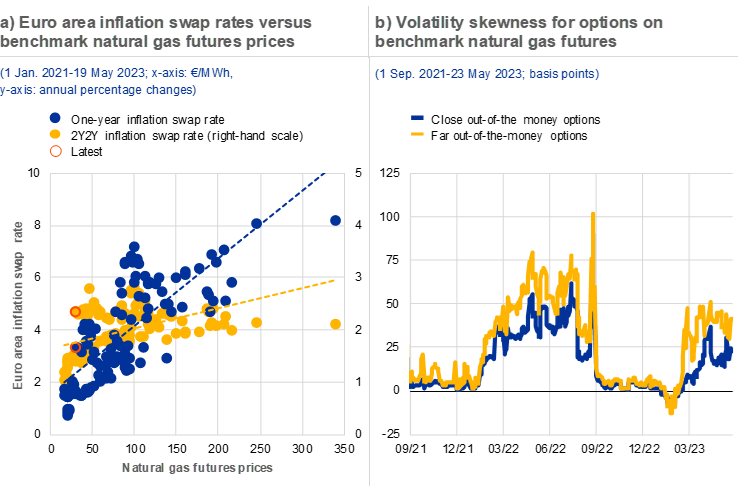
Sources: Bloomberg Finance L.P. and ECB calculations.
Notes: Panel a: prices for benchmark natural gas (TTF) front-month futures listed at ICE Endex. Panel b: close and far out-of-the-money options stand for 25% and 5% delta respectively. Skewness is calculated as the spread between the volatility implied in six-month out-of-the-money call and put options on benchmark natural gas (TTF) front-month futures listed at ICE Endex. Positive values indicate that market participants are more concerned about potentially large price increases than potentially large price drops and are therefore willing to pay more for call options than for the corresponding put options.
2.2 Renewed recession fears could challenge risky-asset valuations
Investors are once again concerned about a potential economic slowdown. The euro area and US government bond yield curves both show a significant and persistent inversion which peaked at the beginning of March (Chart 2.4, panel a). Inverted yield curves are often interpreted as a sign of impending economic downturns.[24] Despite the yield curve inversion and generally tighter financial conditions, many other market segments reflect more optimism with regard to growth prospects. Starting last July, cyclical sectors of the European stock market outperformed defensive sectors (Chart 2.4, panel b). However, this trend reversed sharply following concerns over potential credit tightening as a result of banking sector stress in some mature economies (Chapter 3). As concerns over a possible recession rose, investors rebalanced their portfolios towards safer assets, driving government bond prices substantially higher. This was reflected in a significant decline in the correlation between equities and highly rated debt securities from elevated levels reached in 2022 (Chart 2.4, panel b).[25]
Chart 2.4
Renewed recession fears start to weigh on risky-asset valuations
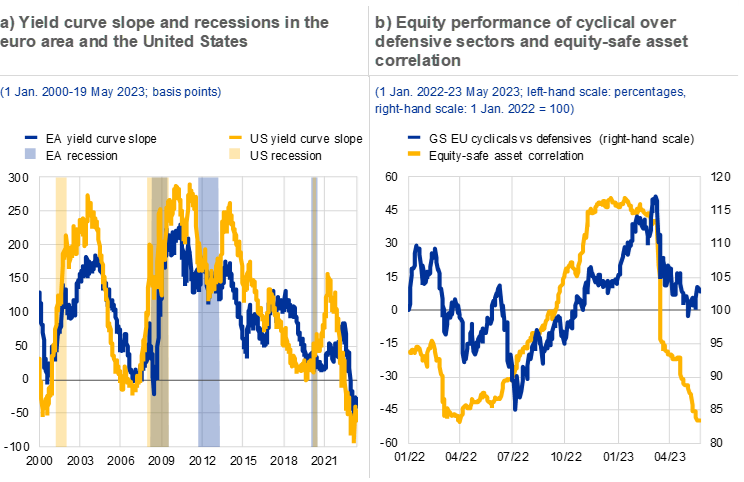
Sources: Bloomberg Finance L.P., CEPR, NBER and ECB calculations.
Notes: Panel a: the yield curve slope is calculated as the difference between ten-year and two-year government bond yields (German bond yields for the euro area). Euro area and US recession periods are those defined by the Centre for Economic Policy Research (CEPR) and the National Bureau of Economic Research (NBER) respectively. Panel b: relative equity performance based on Goldman Sachs (GS) EU cyclicals and defensives indices; the equity-safe asset correlation is the rolling 90-day correlation between EURO STOXX and ICE BofA AAA Euro Government Index returns.
Equity market valuations may be based on overly optimistic expectations for the economy. Since October 2022, the euro area equity market has rebounded significantly on the back of declining interest rates uncertainty (Chart 2.1, panel b) and improved earnings forecasts. The improved profit outlook has been supported by the fading energy crisis and sector-specific factors such as European banks’ growing net interest income (Chapter 3). However, the extent of the market rebound may be based on overly optimistic expectations for the macroeconomic outlook. Since the market bottomed out on 29 September 2022, all euro area sectoral indices have increased by more than the corresponding change in medium-term earnings forecasts (Chart 2.5, panel a), despite higher levels of risk-free rates. Accordingly, valuation metrics for the euro area equity market, which initially declined following the Russian invasion of Ukraine, have since rebounded to levels above historical averages (Chart 2.5, panel b).
The compressed risk premium in equity markets raises concerns over the potential for disorderly corrections in the event of a major economic downturn. One key equity valuation metric which raises concerns over possible overvaluation is the equity risk premium, which compressed substantially during 2022. While prices fell across many asset classes last year, equity markets remained relatively robust, as evidenced by volatility measures. This can be attributed in part to the high-inflation environment, where positive nominal earnings growth makes equities a better inflation hedge for investors than fixed income securities. However, the equity risk premium could widen substantially in the event of a significant economic contraction. In addition, the increased net supply of safe assets resulting from quantitative tightening by major central banks around the world may support higher risk-free rates and may make de-risking more attractive for investors. The crowding out of riskier assets could lead to a less orderly correction in equity and high-yield corporate bond markets (Chapter 4).
Chart 2.5
Equity valuations might reflect an overly benign macroeconomic outlook
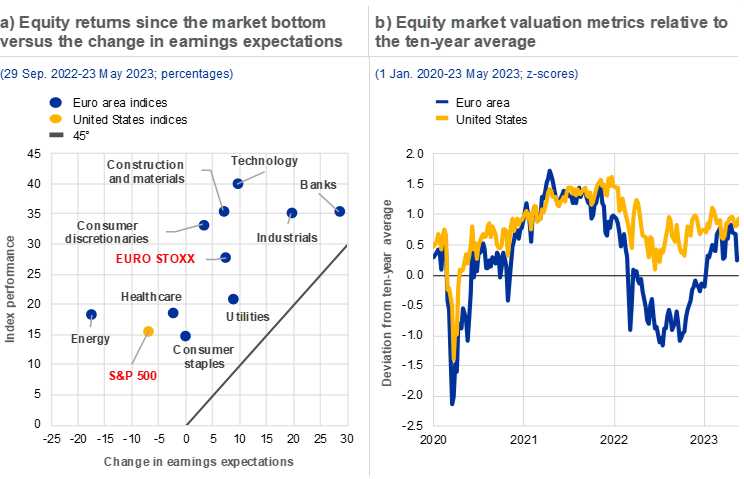
Sources: Bloomberg Finance L.P. and ECB calculations.
Notes: Panel a: broad market bottom: euro area – 29 September 2022, United States – 30 September 2023. Earnings expectations calculated as blended-forward earnings per share. Panel b: average z-scores of price-to-book ratio, price-to-forward (twelve-month) earnings ratio, price-to-long-term (ten-year) inflation-adjusted earnings ratio, and inverse risk premia proxied by five-year CAPE yield less five-year real (inflation swap-adjusted) government bond yield (German for the euro area) for EURO STOXX (euro area) and S&P 500 (United States).
A significant economic contraction would also further increase the likelihood of credit events, potentially precipitating stress in the corporate bond market. Corporate bankruptcies picked up in some euro area countries in 2022 (Chapter 1). Although default rates on corporate bonds remain low, they are expected to rise, particularly for more indebted issuers. Spreads in the high-yield segment are still above the historical average and appear to be consistent with baseline default forecasts from credit rating agencies (Chart 2.6, panel a). However, the recent banking sector stress seen in some mature economies has increased the likelihood of more negative scenarios, which would most likely also lead to a widening of risk premia.[26] In addition, any repricing of corporate bonds could be exacerbated by current low market liquidity (Special Feature A).
Renewed recession fears might also limit issuers’ access to market funding. De-risking trends and continued outflows from investment funds focused on lower-rated issuers could limit the ability of such issuers to roll over their debt (Chapter 4). Although the funding needs of these corporates might appear limited in the near-term, given their relatively low share of high-yield debt maturing in 2023 and 2024 (Chart 2.6, panel b), the ongoing tightening of credit conditions by banks (Chapter 3) could push corporates to seek greater funding from capital markets. As the already-subdued primary market activity in the high-yield segment has deteriorated further since early March, the refinancing risk is still high for more indebted companies. In addition, individual corporates could also face impaired market access following rating downgrades, as the investment mandates of some institutional investors restrict the purchase of lower-rated securities.[27]
Chart 2.6
High-yield corporate bond markets might face challenges if the macroeconomic environment deteriorates, although near-term refinancing needs are limited
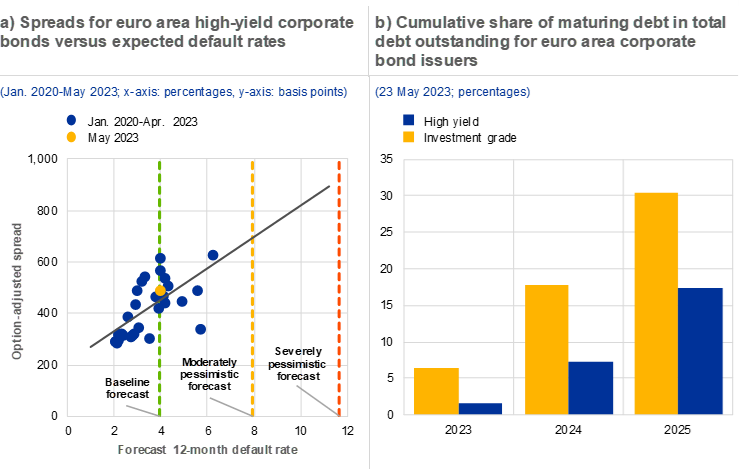
Sources: Bloomberg Finance L.P., Moody’s Analytics and ECB calculations.
Notes: Panel a: option-adjusted spreads based on the average end-of-day value of the Bloomberg Pan-European High Yield (Euro) Average OAS index in a given month; the latest observation is for 23 May. The forecast default rate is based on the Moody’s Analytics forecast of the trailing 12-month default rate one year ahead, with the latest estimate period ending in April 2024. The trendline shows a linear regression. Moderately and severely pessimistic forecasts by Moody’s Analytics assume one or more of the following: (1) more failures in the financial sector, (2) accelerating inflation leading to higher interest rates and a deeper recession, (3) an escalation of the war between Russia and Ukraine, (4) the inability of the US Congress to raise the debt ceiling in time, (5) a rapid erosion of Europe’s relative resilience to the energy shock, (6) a deepening slowdown in the Chinese economy, and (7) a resurgence of COVID-19. Panel b: rating groups based on the average rating assigned to a given issuer.
Vulnerabilities also persist in sovereign bond markets. Renewed recession fears coinciding with still-elevated inflation have increased interest rates volatility (Chart 2.1, panel b). Such volatility has been strongly correlated with sovereign bond spreads, with greater sensitivity for medium and lower-rated countries (Chart 2.7, panel a). Moreover, as a large share of outstanding sovereign debt was issued in a low interest rate environment, governments will face growing refinancing costs for a considerable period of time (Chapter 1). This potential increase in costs is also greater for medium and lower-rated sovereigns (Chart 2.7, panel b), making their debt more vulnerable to market sentiment going forward. However, the pace of such an adjustment is expected to be slower for those countries which have managed to substantially increase the average maturity of their debt over the last decade. In addition, the ECB’s Transmission Protection Instrument reduces the risk of a deterioration in financing conditions which is not warranted by country-specific fundamentals.
Chart 2.7
Euro area sovereign spreads may be sensitive to interest rates volatility and higher government refinancing costs
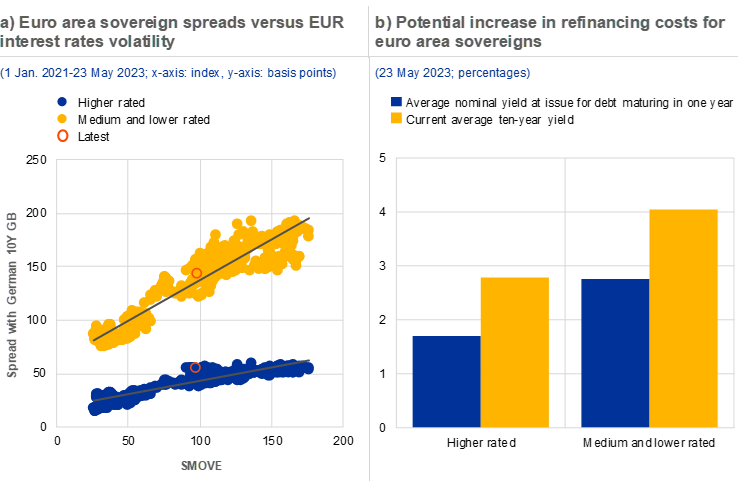
Sources: ECB, Bloomberg Finance L.P. and ECB calculations.
Notes: Medium and lower-rated countries, defined here as those having at least one credit rating below Aa3 (Moody’s) or AA- (Fitch and S&P). Other euro area countries are considered higher rated. Panel a: SMOVE is the Merrill Lynch 1M EUR Swaption Volatility Estimate Index. Panel b: nominal yield at issuance was calculated for the debt outstanding as at the end of April and represents the total cost of debt (interest payments and discount). Average was weighted by the face value of the maturing debt. Ten-year government bond yields were taken as a liquid benchmark. Individual countries might, however, issue new debt with different maturities and therefore at a lower or higher cost than indicated by the ten-year yield.
2.3 Global vulnerabilities might spill over to the euro area
A shift away from the low interest rate environment in Japan could test the resilience of global bond markets.[28] Inflation in Japan has been increasing over the past year, leading market participants to expect the Bank of Japan to start normalising its monetary policy. These expectations have resulted in a growing deviation between the Japanese ten-year overnight index swap (OIS) rate and the government bond yield capped by the policy of yield curve control (Chart 2.8, panel a). On 20 December 2022 the Bank of Japan announced an adjustment to this policy tool by widening the respective tolerance band to between around plus and minus 50 basis points.[29] As a result, the ten-year government bond yield quickly increased and the yen appreciated by around 3% against the euro and US dollar. If the Bank of Japan decides to normalise its policy, this might influence the decisions of Japanese investors who have a large footprint in global financial markets, including the euro area bond market (Chart 2.8, panel b). In particular, a rapid decline in rate differentials and increased exchange rate volatility could reduce the attractiveness of their carry trades.[30] In addition, policy normalisation could lead to wider term premia on local government bonds, which could also stimulate the repatriation of portfolio investments. Finally, valuation losses on local bond portfolios and higher risk-free rates could inhibit the investors’ risk-seeking behaviour, including their willingness to invest abroad. Japanese investors withdrawing abruptly from the euro area bond market could have a material effect on prices, particularly in more concentrated market segments. Such dynamics could be amplified by the increased net supply of these bonds resulting from quantitative tightening by the ECB.
Chart 2.8
Policy normalisation in Japan might have a sizeable effect on global bond markets
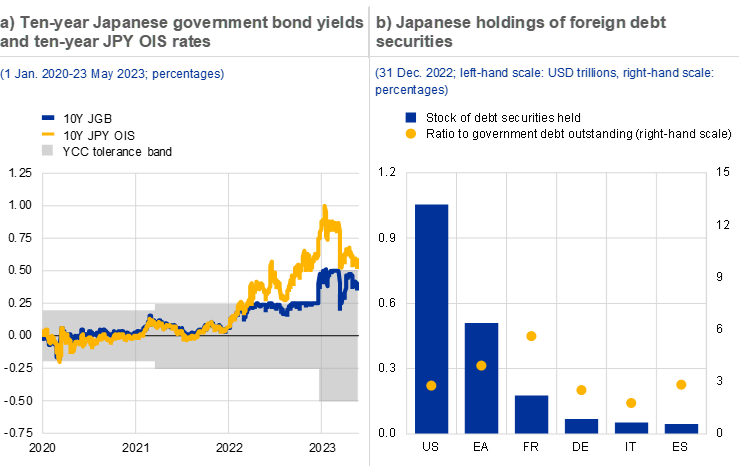
Sources: Bloomberg Finance L.P., Haver Analytics, Japan’s Ministry of Finance and ECB calculations.
Notes: Panel a: JGB stands for Japanese government bonds; YCC stands for yield curve control. Panel b: the ratio to the respective country’s government debt is for illustrative purposes, as the stock of debt securities includes all debt held by Japanese investors in all sectors of the respective country (not just the government sector).
An inability to raise the US debt ceiling in a timely manner may also lead to increased market volatility. On 19 January 2023 the United States reached the maximum amount of debt that the Department of the Treasury can issue. Since then, the government has had to rely on accumulated cash buffers or use extraordinary measures to finance its spending, including debt service. Although a technical default on outstanding debt is considered to be an extreme tail risk, a prolonged political stalemate might fuel volatility in global markets, with spillovers to the euro area. This was the case in 2011 when equity indices declined globally, despite the debt ceiling being raised before any payments were delayed (Chart 2.9, panel a). Negative sentiment was also fuelled by one rating agency downgrading the US long-term sovereign credit rating by one notch, which was linked to the debt ceiling debate. Similarities to 2011, in terms of the division of political power and the challenges for fiscal policy stemming from a higher interest rate environment, have heightened investor concerns over potential market spillovers in 2023 as well. These concerns are reflected in the rising prices of CDS contracts on debt issued by the United States, which have reached levels that are higher than those seen in 2011 (Chart 2.9, panel b)[31]. In addition, any volatility spike could be accentuated by relatively low liquidity in the US bond market.
Chart 2.9
Political stalemate linked to the US debt ceiling might adversely affect global markets
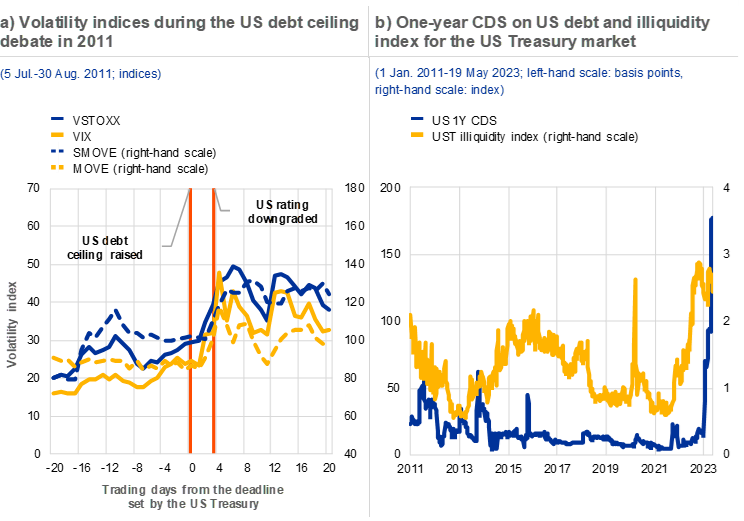
Sources: Bloomberg Finance L.P. and ECB calculations.
Notes: Panel a: SMOVE is the Merrill Lynch 1M EUR Swaption Volatility Estimate Index. Panel b: spreads for euro-denominated one-year CDS contracts on US Treasuries. Illiquidity in the US Treasury market is proxied by the Bloomberg UST Liquidity Index, which displays the average yield error across the universe of US Treasury notes and bonds with remaining maturity of one year or more, based on the intraday Bloomberg relative value curve fitter.
Rapidly growing intraday leverage in the US equity market raises the risk of disorderly market moves. High levels of interest in trading S&P 500 options on the day of their expiry (commonly referred to as “0 days to expiry” or “0DTE”) resulted in the Cboe Exchange expanding the offer of these instruments. As a result, trading in S&P 500 options has soared and recently reached an all-time high (Chart 2.10, panel a), with 0DTE options accounting for between 40% and 45% of traded volumes.[32] Their short maturity makes these options much cheaper than longer-dated options. As a result, they offer extremely high leverage to investors (Chart 2.10, panel b), which magnifies their impact on the underlying stock market. Furthermore, the effective exposure stemming from these options is very sensitive to even small changes in the underlying equity index. This means that, to ensure that their own portfolios remain hedged, the sellers of these options (typically market-makers) must rapidly trade the underlying securities in line with the short-term trend. As a result, these transactions might further fuel current price momentum and volatility, creating a high degree of procyclicality. This constitutes a structural vulnerability in the event of large, abrupt swings in investor sentiment. In the current environment of high market sensitivity to macroeconomic data, negative surprises might lead to sudden and disorderly corrections in US equity markets, with spillovers potentially also affecting wider financial markets.
Chart 2.10
Growing leverage in the US equity market might exacerbate procyclical behaviour and price volatility
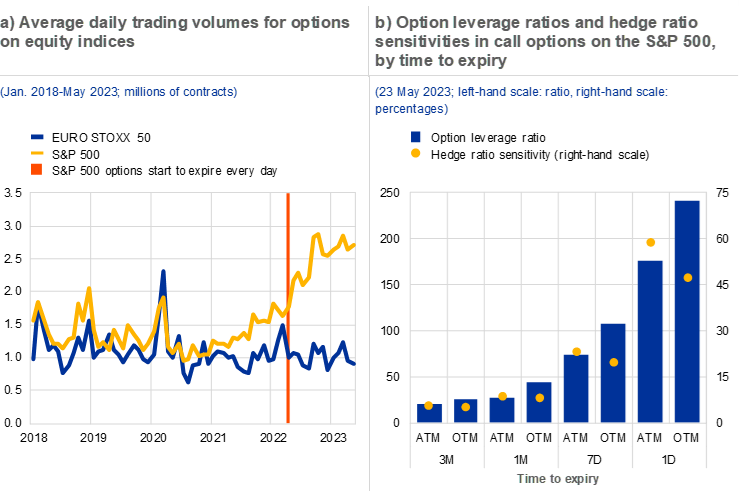
Sources: Bloomberg Finance L.P. and ECB calculations.
Notes: Panel a: the latest observation is for 23 May. Panel b: the option leverage ratio (i.e. the option lambda parameter) is calculated as the value of the delta-equivalent position over the option price. Hedge ratio sensitivity (i.e. the option gamma parameter) is calculated as the sensitivity of the option delta parameter to the price of the underlying. At-the-money (ATM) and out-of-the-money (OTM) options represent options closest to 50% and 25% delta respectively.
Box 3
Do global investment funds have a stabilising effect on euro area government bond markets?
This box analyses the role and behaviour of global and domestic investment funds in euro area government bond markets. Over the last year, yields have increased for many euro area sovereigns, while net debt issuance has remained positive (Chart A, panels a and b). Against this background, it is useful to assess how investors might change their holdings of sovereign bonds as central banks reduce their footprint in these markets. In addition, investment decisions are also driven by risk appetite, which can be affected by both global and euro area-specific shocks. The analysis presented in this box focuses on how investment funds react to such global and euro area risk shocks and draws implications for financial stability.
More3 Euro area banking sector
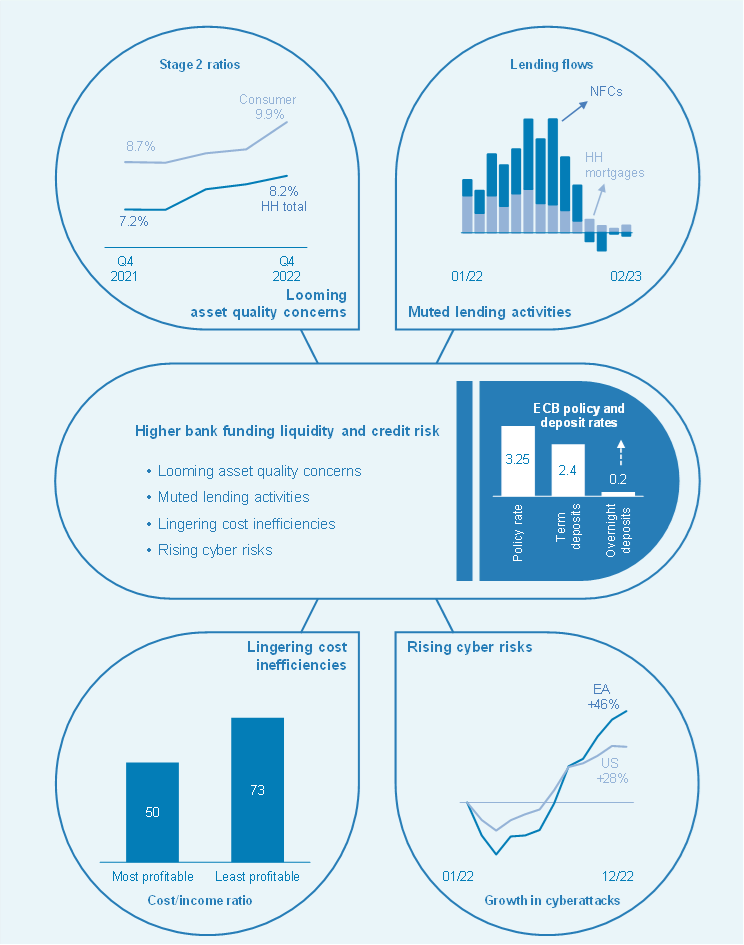
3.1 Compressing valuations and tighter funding conditions
After a strong start to 2023, the share prices of euro area banks declined sharply in March as volatility and default risk premia surged. Between October 2022 and the beginning of March 2023, bank share prices rose by 50%, driven by rising interest rate margins supported by higher policy rates, and an improving macro environment after China ended its zero-Covid policy. This positive sentiment partly went into reverse when two US banks – Signature Bank and Silicon Valley Bank – failed and Credit Suisse was acquired by UBS, a case which underscored the importance of good corporate governance and effective risk controls for business model viability (Chart 3.1, panel a, left graph). While the acquisition of Credit Suisse – a global systemically important bank – caused volatility to surge among bank stocks across advanced economies (Chart 3.1, panel a, right graph), volatility levels nevertheless remained well below those seen at the start of the pandemic. Uncertainty about the riskiness of the senior unsecured securities issued by euro area banks caused a sudden rise in their CDS spreads, with some more affected than others. The fact that expected default frequencies of euro area banks only increased slightly and that there were no downward revisions of their rating outlooks would suggest that these market dynamics were driven more by uncertainties about securities valuations and/or contagion fears, which were not accompanied by a deterioration of bank fundamentals (Chart 3.1, panel b).
Chart 3.1
Bank stock prices fell in March after a long rally, while volatility and CDS spreads surged, but underlying fundamentals did not point to a rise in euro area bank risk
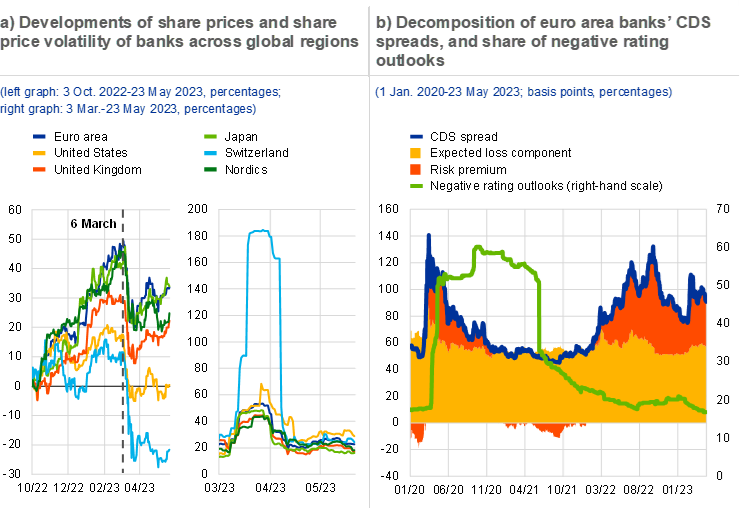
Sources: Bloomberg Finance L.P., DBRS, Fitch Ratings, Moody’s Analytics, S&P Global Market Intelligence and ECB calculations.
Notes: Panel a: the sample consists of 71 global listed banks. Share prices and one-month annualised historical share price volatility across regions are weighted by banks’ total assets. Panel b: the decomposition of the CDS spread into the risk premium and the expected loss component is based on the five-year senior CDS spreads and the five-year expected default frequencies of 32 euro area banks.* The euro area aggregates shown are calculated on the basis of bank total asset weights.
*) For more details on the approach, see the box entitled “Price of default risk as a measure of aversion to credit risk”, Financial Stability Review, ECB, December 2008.
High reliance on customer deposits and long-term bond funding helped to increase the resilience of the euro area banks’ funding base. The rapid rise in interest rates last year contributed to a decline in the funding liquidity of banks due to rollover, redemption and margin risks. It also exposed some fragilities, such as reliance on potentially flighty short-term funding in some financial institutions, which requires close monitoring (Special Feature A). On aggregate, however, the shares of more stable customer deposits in banks’ funding structures have increased since the global financial crisis and loan-to-deposit ratios have declined, partly in response to the ECB’s expansionary monetary policy (Chart 3.2, panel a). For the euro area on aggregate, deposits fund about 70% of banks’ liabilities. The largest providers of those funds are households followed by corporates, accounting for 47% and 25% of banks’ liabilities respectively. Stable retail deposits represent over 40% of total deposits (Chart 3.3, panel b, left graph). Market funding via bonds contributes another 15% to banks’ liabilities, with non-banks as major investors in bank debt securities (Special Feature B). Covered bonds, senior unsecured bonds and three classes of bonds eligible under the minimum requirement for own funds and eligible liabilities (MREL) have broadly similar shares (Chart 3.2, panel b). The decline in excess liquidity associated with repayments of the targeted longer-term refinancing operations (TLTRO) led to a gradual decline in banks’ liquidity coverage ratios. However, euro area banks on aggregate hold substantial liquidity buffers, mainly in the form of central bank reserves and government bonds. This availability of collateral limits the risks related to potential adverse market developments. The medium-term resilience of bank funding is reflected in their net stable funding ratios, which have declined only slightly since the end of 2021 and remain well above minimum requirements (Chart 3.2, panel c).
Chart 3.2
Euro area banks have a robust funding mix and substantial buffers of high-quality liquid assets following regulatory reforms implemented after the global financial crisis
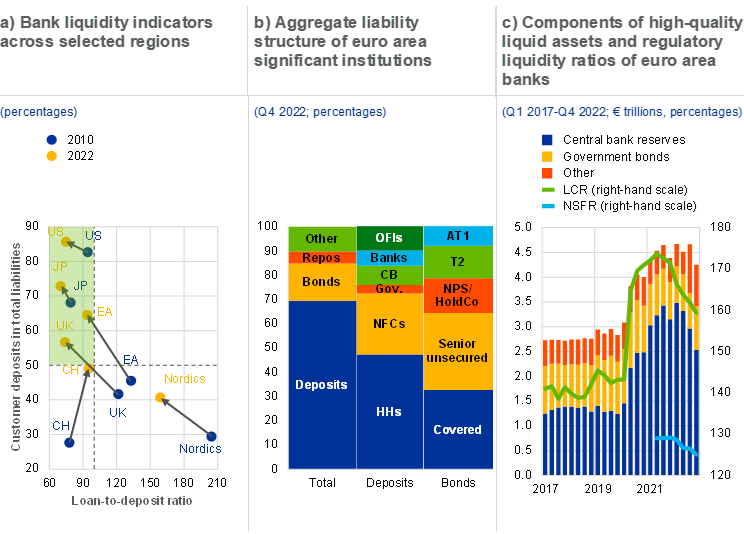
Sources: Bloomberg Finance L.P., ECB and ECB calculations.
Notes: Based on a balanced sample of 83 euro area significant institutions. Panel a: the vertical dashed line indicates a loan-to-deposit ratio of 100%, while the horizontal dashed line indicates a customer deposit share of 50%. Panel b: OFIs stands for other financial institutions; CB stands for central banks; Gov. stands for governments; NFC stands for non-financial corporations; HHs stands for households; AT1 stands for Additional Tier 1 securities; T2 stands for Tier 2 securities; NPS/HoldCo stands for senior non-preferred securities. Panel c: LCR stands for liquidity coverage ratio; NSFR stands for net stable funding requirement. NSFR data are only available from mid-2021, when this ratio became a legal requirement.
The pass-through of higher interest rates to depositors has been slow but deposit rates are gradually rising, weighing on overall funding costs. With the exception of some term deposits, banks have so far passed only a small fraction of the rise in policy rates through to depositors, which is reflected in low “deposit betas” (Chart 3.3, panel a, left graph and Box 4). Rising policy rates led to a surge in margins last year, helping to support bank profitability. Given the difference in rates on agreed maturity and overnight deposits, customers have started shifting some of their funds to deposit types where the remuneration offered is higher (Chart 3.3, panel a, right graph). Banks are likely to increase average deposit rates further in order to prevent outflows to competitors as customers seek higher-yielding savings products. While some deposit outflows have been observed since the beginning of this year (Chart 3.3, panel b, right graph), they tend to reflect seasonal patterns and outflows from financial customers due to portfolio adjustments towards higher-yielding instruments.
Chart 3.3
Banks have so far been slow to pass higher rates through to depositors, while benefiting from the stability of a retail-dominated deposit base
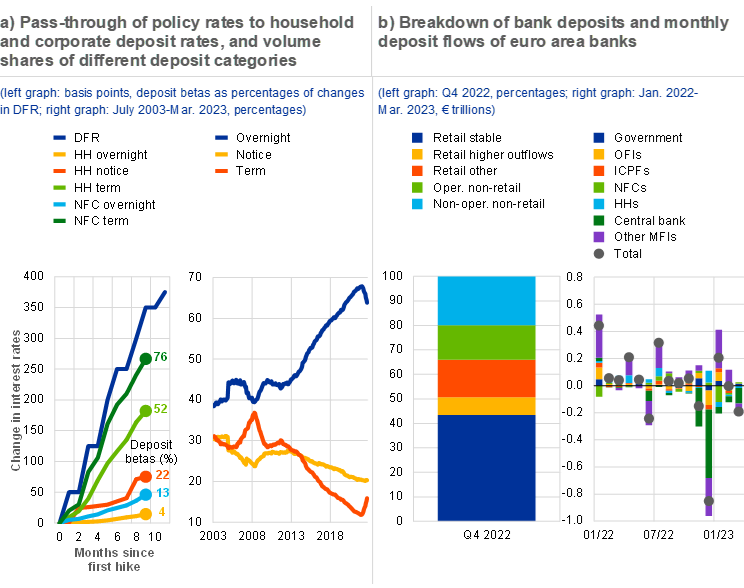
Sources: ECB and ECB calculations.
Notes: Panel a: deposit betas capture the percentage pass-through of the increase in the ECB’s deposit facility rate to household and corporate new business deposit rates since the start of the rate hiking cycle in July 2022. The right graph shows overnight, notice and term deposits aggregated for households and non-financial corporates. The volume shares refer to the outstanding stock. DFR stands for the ECB’s deposit facility rate; HH stands for household; NFC stands for non-financial corporation. Panel b: the left graph shows the decomposition of bank deposits according to their stability and is based on a sample of 83 euro area significant institutions. Specifically, retail deposits subject to higher outflow rates are defined in line with Article 25(2) of Commission Delegated Regulation (EU) 2015/61 to supplement Regulation (EU) 575/2013 of the European Parliament and the Council with regard to liquidity coverage requirement for credit institutions. The right graph shows monthly deposit flows of euro area monetary financial institutions. OFIs stands for other financial institutions; ICPFs stands for insurance corporations and pension funds; NFCs stands for non-financial corporations; HHs stands for households; MFIs stands for monetary financial institutions.
Box 4
Euro area bank deposit costs in a rising interest rate environment
Changes in the cost and the composition of bank deposits have important implications for banks’ net interest income. This, in turn, affects their retained earnings, capital position, overall resilience and hence their ability to provide credit to the real economy. The ultimate impact of higher policy rates (Chart A, panel a) on banks’ net interest income depends, in particular, on the structure of their balance sheets and the sensitivity of their deposit and lending rates to policy rates.[33]
MoreRolling over maturing bonds will increase the market funding costs of banks over the next three years. Secondary market yields on bank bonds have risen substantially since the beginning of 2022. By 2026 rolling over senior bank bonds at current yields would nearly double the cost of bond funding (Chart 3.4, panel a) and reduce aggregate sector return on equity by around 50 basis points per year. This aggregate picture for the euro area does, however, mask sizeable differences across individual banks, as issuer ratings have a substantial impact on bond yields, in particular for unsecured bonds. Bond issuance volumes have picked up, possibly in anticipation of a further rise in interest rates and gradual TLTRO repayments. Last year bond issuance exceeded the 2015-19 average by 25%, and the first quarter of 2023 saw issuance volumes 36% higher than in the pre-pandemic years. Issuance has been particularly strong for covered bonds which, because they are secured, represent the cheapest form of bond funding but at the same time increase asset encumbrance. The cost of issuing the most junior securities has been highly volatile recently (Chart 3.4, panel b, left graph). That said, the impact of these securities on overall bank profitability is more muted than for senior bonds, even if adverse market conditions persist, as their weight in total funding is low and there is no contractual obligation to redeem these bonds. While about 65% of Additional Tier 1 (AT1) bonds may be called by issuers within the next three years (Chart 3.4, panel b, right graph), these bonds are perpetual and banks do not have to exercise the call option if doing so would be uneconomical.
Chart 3.4
About half of euro area banks’ senior bonds need to be rolled over at higher costs, and spreads of most junior bonds increased substantially in March
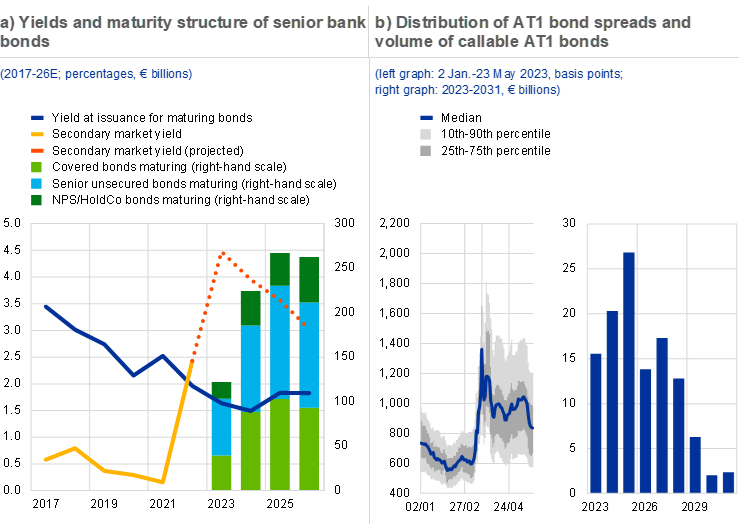
Sources: Dealogic, S&P Dow Jones Indices LLC and/or its affiliates, Bloomberg Finance L.P. and ECB calculations.
Notes: Panel a: issuance and secondary market yields of senior bonds are calculated as the average yields weighted by the nominal amounts of covered, senior unsecured and NPS/HoldCo bonds. NPS/HoldCo stands for senior non-preferred securities.
3.2 Profits boosted by higher interest rates, as banking sector faces uneven prospects
Rising interest margins helped boost the profitability of euro area banks in 2022, particularly in countries with large volumes of variable-rate lending. The aggregate return on equity (ROE) of euro area significant institutions (SIs) rose by 1 percentage point last year to 7.6%.[34] In contrast with 2021, when a reduction of loan loss provisions was the main factor behind improving profitability, the improvement in 2022 was largely driven by higher core revenues (Chart 3.5, panel a). Interest margins surged on the back of the substantial rise in policy interest rates starting in the summer of last year, while banks adjusted their deposit rates slowly. Margin expansion tended to be higher in those countries with a larger share of loans granted at variable interest rates, but other factors also played a role, such as banks’ hedging behaviour and the interest rate profile outside the banking book. In addition, lending volumes made a positive contribution to growth in net interest income (NII) in most countries during the first three quarters of last year (Chart 3.5, panel b, right graph). Conversely, NII rose less strongly in countries such as France where fixed-rate lending predominates and banks had already increased deposit rates to a larger extent. Net fee and commission income (NFCI) also increased, although at a slower rate than in 2021, while expenses continued to rise (Chart 3.5, panel b, left graph). First quarter 2023 earnings results for listed banks suggest that despite lower trading income and higher costs, profitability improved further on the back of higher NII.
Chart 3.5
Bank profitability improved further in 2022 on the back of stronger net interest income driven by higher margins, especially in countries with variable interest rates
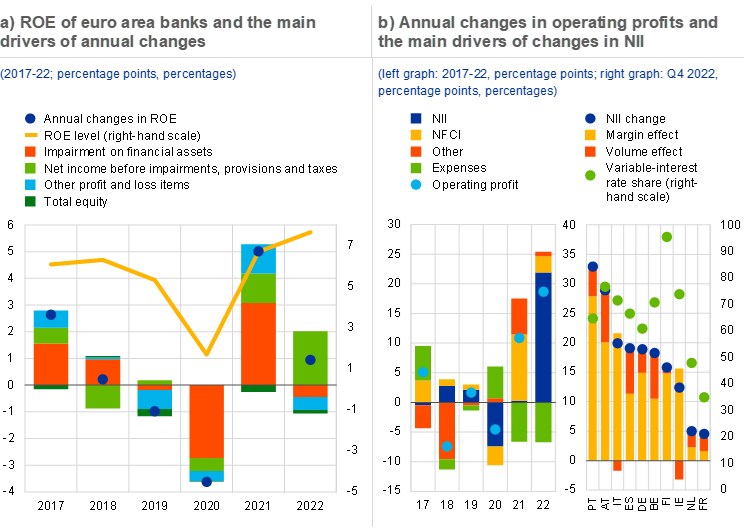
Sources: ECB and ECB calculations.
Notes: based on a balanced sample of 83 euro area significant institutions. Panel b: the share of lending at variable rates is based on new business volumes and refers to lending with a variable interest rate and an interest rate fixation period of up to one year. NII stands for net interest income; NFCI stands for net fee and commission income.
Despite the banking sector stress in March of this year and slowing lending dynamics, market analysts expect euro area bank profitability to increase further in 2023. Market expectations of the future aggregate ROE of listed euro area banks for 2023 have been revised upwards sizeably since the start of this year, with ROE projections increasing from 8.1% to 9.2% between the end of last year and the beginning of March (Chart 3.6, panel a). Most of this improvement was driven by higher expected NII in an environment where interest rate projections were revised to remain higher for longer, more than offsetting the potential impact of tighter credit standards and subdued lending growth. Expectations of lower impairments represent a second important positive factor, reflecting an improvement in the euro area macroeconomic outlook since the start of this year. The compression in banks’ market valuations in March and higher bank funding costs did not appear to weigh on bank profitability as ROE expectations increased further to 10.6% at the end of May. The additional upward revisions of ROE expectations since March can be attributed mainly to higher NII, coupled with lower costs, higher NFCI and lower impairments. Bank analysts may well revise their ROE projections down going forward, given considerably tighter bank lending standards, a slump in loan demand and more muted lending dynamics for NFCs in particular as a consequence (Chart 3.6, panel b).
Chart 3.6
ROE projections for 2023 were revised upwards strongly this year, despite tighter credit standards and subdued growth in lending to NFCs in particular
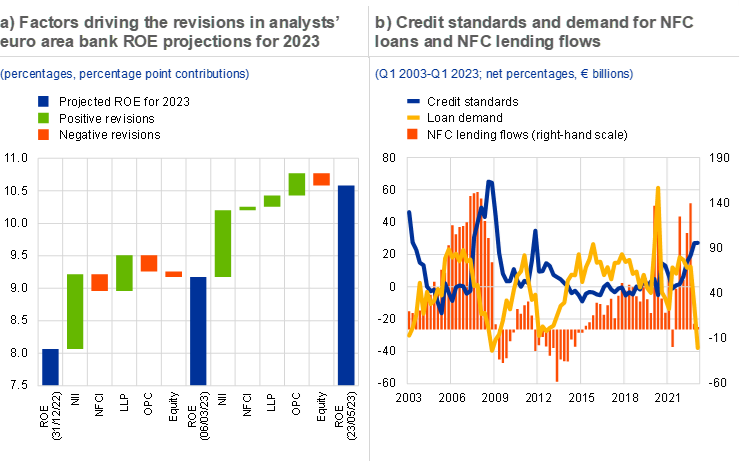
Sources: Bloomberg Finance L.P., Refinitiv, ECB and ECB calculations.
Notes: Panel a: based on a balanced sample of 83 euro area significant institutions. ROE stands for return on equity; NII stands for net interest income; NFCI stands for net fee and commission income; OPC stands for operating costs. Panel b: for credit standards, net percentages are defined as the difference between the sum of the percentages of banks responding “tightened considerably” and “tightened somewhat” and the sum of the percentages of banks responding “eased somewhat” and “eased considerably”. Net percentages for the questions on demand for loans are defined as the difference between the sum of the percentages of banks responding “increased considerably” and “increased somewhat” and the sum of the percentages of banks responding “decreased somewhat” and “decreased considerably”. NFC stands for non-financial corporation.
The strong profitability of euro area banks on aggregate masks substantial heterogeneity across individual banks, with the differences still driven by structural issues. Rising interest rates have boosted banks’ lending margins, thereby lifting profitability to levels not seen in a decade. Taking a closer look at bank profitability patterns across ROE quartiles, however, reveals lingering underlying structural issues. The ROE differential between the best and the worst performing quartiles declined until 2017, but remained persistently close to a level of 12 percentage points thereafter. In addition, a cohort of institutions in the lowest profitability quartile has found it hard to reach sustainable profitability levels (Chart 3.7, panel a). As discussed in previous issues of the Financial Stability Review, legacy asset quality problems and cost inefficiencies appear to be the two main underlying causes.[35] While the former has been largely addressed since the establishment of the Single Supervisory Mechanism, which is reflected to some extent in improved profitability among the weakest banks, differences in the level of cost efficiency across the profitability spectrum of banks have hardly shifted during this period. While cost efficiency improved for both the best- and the worst-performing banks between 2016 and 2022, the cost/income ratio of the weakest banks is still 22 percentage points higher than for their top-performing peers (Chart 3.7, panel b). Addressing these pockets of weak bank profitability remains key for ensuring a healthy and resilient banking sector that can continue to fulfil its credit intermediation function even in times of economic uncertainty.
Chart 3.7
ROE dispersion across euro area banks highlights lingering cost inefficiencies
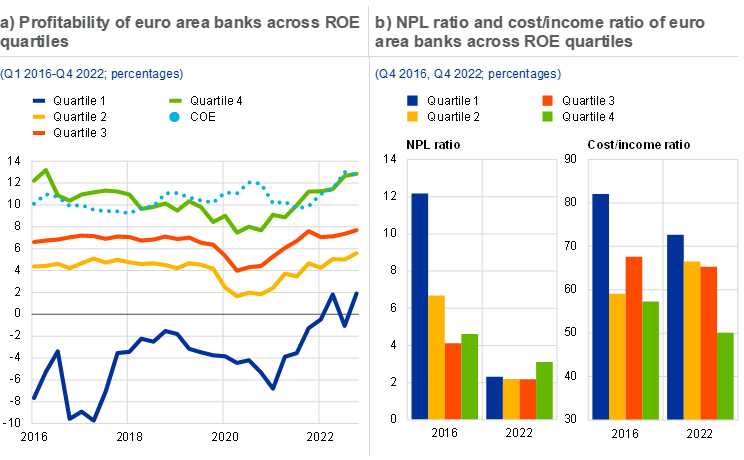
Sources: ECB and ECB calculations.
Notes: Based on a balanced sample of 83 euro area significant institutions. Panel a: Altavilla et al.* estimate the cost of equity of euro area banks as an average across ten different models (five implied cost of equity models and five factor models) which are estimated for individual listed euro area banks and then weighted by market capitalisation. COE stands for cost of equity. Panel b: the cost/income ratio is calculated as operating expenses divided by operating income.
*) Altavilla, C., Bochmann, P., De Ryck, J., Dumitru, A., Grodzicki, M., Kick, H., Melo Fernandes, C., Mosthaf, J., O’Donnell, C. and Palligkinis, S., “Measuring the cost of equity of euro area banks”, Occasional Paper Series, No 254, ECB, 2021.
3.3 Declining yet robust solvency, and rising cyber risks
The capital ratios of euro area banks declined in 2022, reflecting stronger lending and higher average riskiness of total assets. The aggregate Common Equity Tier 1 (CET1) ratio of euro area banks declined by around 40 basis points last year to 15%. This was mainly due to risk-weighted asset (RWA) growth, driven mostly by rising average risk weights but also, to a lesser extent, by growing total assets. The increase in RWAs stemmed mainly from robust lending growth to non-financial corporations which continued until the third quarter. In addition, the positive contribution from retained earnings, related to one-off effects from banks reclassifying share premiums to retained earnings, was more than offset by other changes in equity and higher payouts to shareholders (Chart 3.8, panel a). The decline in capital ratios is also reflected in banks’ shrinking, albeit robust, distance to their maximum distributable amount (MDA) threshold over the course of last year (Chart 3.8, panel b, left graph).
As bank profitability improved, distributions to shareholders increased and are expected to remain high in the coming years. Stronger profitability allowed average dividends and share buybacks to be increased to 1.5% of RWA in 2022 from 0.7% during the pre-pandemic period (Chart 3.8, panel b, right graph). Banking sector stresses in March 2023 have had little impact on future capital distributions. While changes in dividend futures prices since March suggest that payouts for 2024 are expected to decline by around 15%, payout expectations for this year have only been revised downwards marginally and banks have so far maintained their guidance on future share buybacks.
Chart 3.8
Solvency ratios declined in 2022 due to higher RWAs, and a declining distance to MDA highlights the trade-off between higher buffers and shareholder payouts
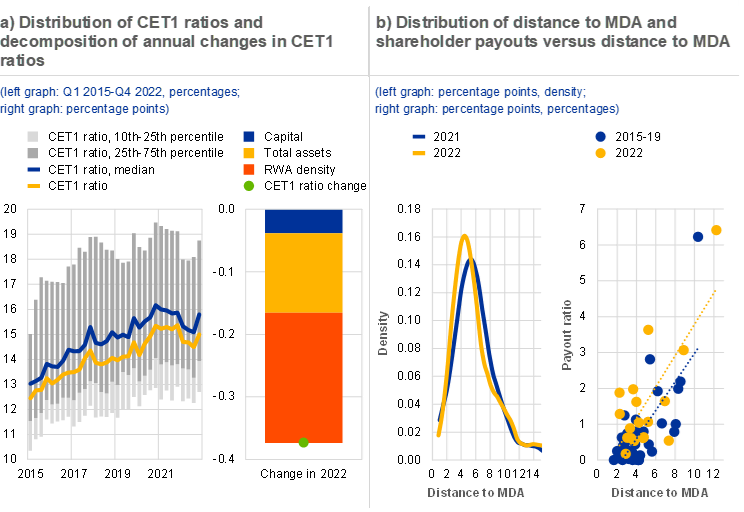
Sources: ECB and ECB calculations.
Notes: Based on a balanced sample of 83 euro area significant institutions. Panel b: payouts include dividends and share buybacks. The payout ratio is defined as total payouts divided by risk-weighted assets.
Incidences of cyberattacks increased further last year, above the pandemic peak, reflecting elevated threats to bank operations. The number of global cyberattacks increased by around 45% in 2022 compared with the previous year and exceeded the peak observed during the pandemic.[36] Increases in publicly disclosed cyberattacks varied greatly across regions, rising by 51% in euro area countries, 23% in the United States and 72% in other countries (Chart 3.9, panel a). The economic sectors targeted most by cyberattacks seem to be changing, with a decline evident in the share of total cyberattacks aimed at pandemic-sensitive sectors like healthcare, education, retail and IT. Conversely, it appears that core economic sectors, such as public administration, science, manufacturing and finance, are being increasingly targeted (Chart 3.9, panel b).
Chart 3.9
Global cyberattacks reached a new peak in 2022, with the focus shifting back towards industry, finance and the public sector
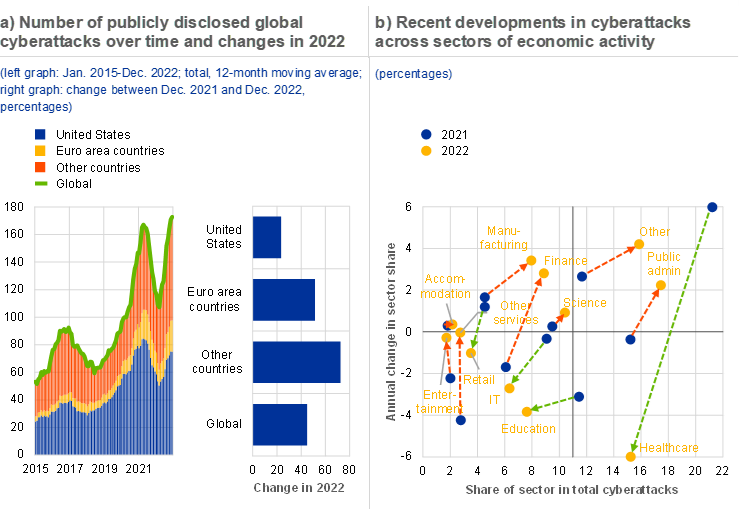
Sources: University of Maryland CISSM Cyber Events Database and ECB calculations.
3.4 Asset quality concerns rise as economic outlook weakens
On aggregate, non-performing loans (NPLs) were not badly affected by worsening economic conditions in the second half of 2022. Banks’ NPL ratios for total loans and for loans to the non-financial private sector declined only marginally in the second half of 2022 (Chart 3.10, panel a, left graph). A decomposition of quarter-on-quarter changes in NPLs shows that the contribution of declines in NPL stocks slowed considerably during 2022 following the significant NPL disposals seen in 2021 (Chart 3.10, panel a, right graph). This suggests that banks’ aggregate NPL ratio may be close to reaching its trough, not least given the fact that NPL trends lag economic developments. Default rates on exposures to euro area corporates picked up in the second half of 2022, albeit remaining at low levels (Chart 3.10, panel b). At the same time, aggregate corporate vulnerabilities are expected to increase, although by less than previously expected (Chapter 1).
Chart 3.10
The aggregate NPL ratio declined only marginally in the second half of 2022, while corporate default rates picked up
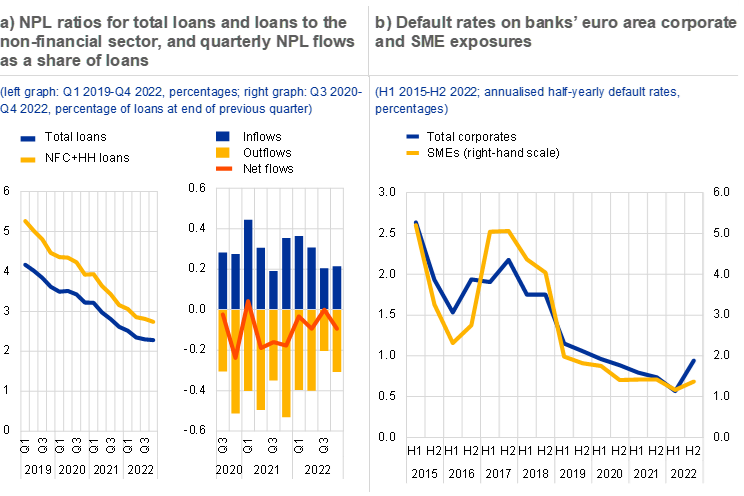
Sources: ECB and ECB calculations.
Notes: Panel a: the NPL ratio for total loans excludes cash and central bank balances. NFC stands for non-financial corporations; HH stands for households. Panel b: based on 61 and 56 significant institutions which use the internal-rating based approach for total corporate and SME exposures respectively.
Early warning signs of asset quality deterioration have become more pronounced as there has been some evidence of an increase in Stage 2 loans. Stage 2 ratios for both loans to NFCs and loans to households increased in the first half of 2022 amid a worsening economic outlook. In the second half of the year, by contrast, they diverged, with the Stage 2 ratio dropping slightly for NFC loans and continuing to edge up for household loans (Chart 3.11, panel a). However, the recent improvement in the aggregate NFC Stage 2 ratio masks considerable heterogeneity at the country level, as the number of countries recording increases and declines in Stage 2 ratios for NFC loans in 2022 was roughly equal. Taking into account the reporting lag, the Stage 2 ratio for total loans appears to have moved in tandem with consensus GDP growth forecasts for 2023 (Chart 3.11, panel b), although changes in the Stage 2 ratio were relatively small, considering the weakening growth outlook. This suggests that a renewed deterioration in the growth outlook could lead to (further) increases in Stage 2 loans and higher provisioning needs.
Chart 3.11
Stage 2 ratios for household loans gradually rose further in the second half of 2022, but declined slightly for NFC and total loans
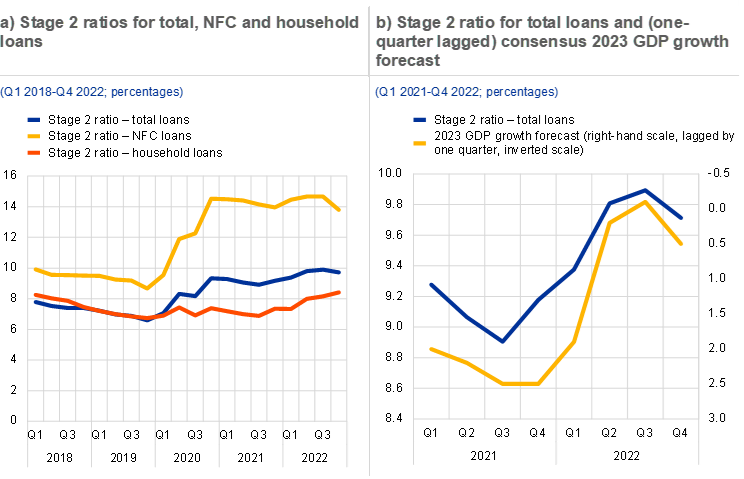
Sources: Bloomberg Finance L.P. and ECB.
Note: Stage 2 ratios are based on data for 102 IFRS-reporting significant institutions.
Within the corporate sector, there are emerging concerns about the outlook for commercial real estate (CRE) loans. Despite worries about an ongoing downturn in the commercial property market (Chapter 1), growth for CRE loans accelerated to 7% in 2022, outpacing growth for total loans by around 3 percentage points. CRE loans remain a relatively small part of the loan book, however, accounting for little more than 8% of the total loans granted by significant institutions, although this share varies within a wide range across banks. The majority of this exposure is located in the euro area, while US CRE loans, where vacancy rates are substantially higher (Chapter 1), are limited to around 6% of significant institutions’ total CRE loans, or 0.5% of their total loans. Following an increase in the second quarter, the aggregate Stage 2 ratio for CRE loans dropped slightly in the last two quarters of 2022, albeit still remaining well above its pre-pandemic level (Chart 3.12, panel a).
Credit risk stemming from banks’ CRE exposures is mitigated by strong collateralisation. The share of CRE loans with higher loan-to-value (LTV) ratios (above 80%) was relatively low on aggregate, at around 20% at the end of 2022 (Chart 3.12, panel b). However, these benign aggregate data hide significant cross-country heterogeneity in terms of both asset quality and collateralisation. Nearly half of all euro area countries saw Stage 2 ratios increase, while NPL ratios also rose slightly in a few countries. Some countries have a share of high-LTV loans in excess of 30%, reaching up to 53% in one case. Overall, banks’ CRE loans remain vulnerable to increasing loan losses should the rise in refinancing costs and weaker demand for commercial property lead to further property price corrections (Chapter 1). This is particularly the case for those banks with a larger share of high-LTV loans or with a higher share of lending exposures related to non-prime properties.
Chart 3.12
The quality of CRE loans remains vulnerable to further property price corrections, although this risk is mitigated by the relatively low share of high-LTV loans
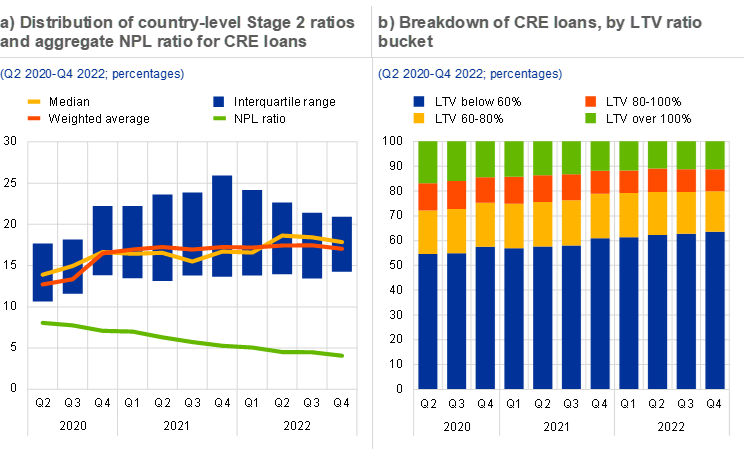
Sources: ECB and ECB calculations.
Notes: Panel a: Stage 2 ratios are based on data for 95 IFRS-reporting significant institutions. Panel b: based on current LTV ratios.
In the household segment, the most material signs of credit quality deterioration in the second half of 2022 were seen in consumer and other (non-mortgage) loans. Consumer loans account for only 6% of significant institutions’ total loans on aggregate, but they are typically more vulnerable to economic downturns, partly because of their low collateralisation. Some signs of worsening credit quality could already be observed during 2022. Following a gradual increase in the first three quarters of the year, the share of Stage 2 consumer loans rose more sharply in the fourth quarter amid worsening economic conditions and high inflation.[37] Stage 2 ratios for other (non-mortgage) household loans also increased significantly during 2022, whereas the rise in Stage 2 ratios for mortgage loans was more contained (Chart 3.13, panel a). At the same time, banks’ provisioning did not keep pace with the increase in underperforming loans, while the NPL provision coverage ratio also continued its downward trend (Chart 3.13, panel b). Banks’ consumer credit exposures remain vulnerable to the negative impacts of still elevated inflation and rising interest rates on households’ repayment capacity, in particular in lower income quintiles.
Chart 3.13
The rise in the share of underperforming loans in 2022 was most pronounced for consumer and other (non-mortgage) household loans, while both NPL and Stage 2 coverage ratios for consumer loans have continued to decline
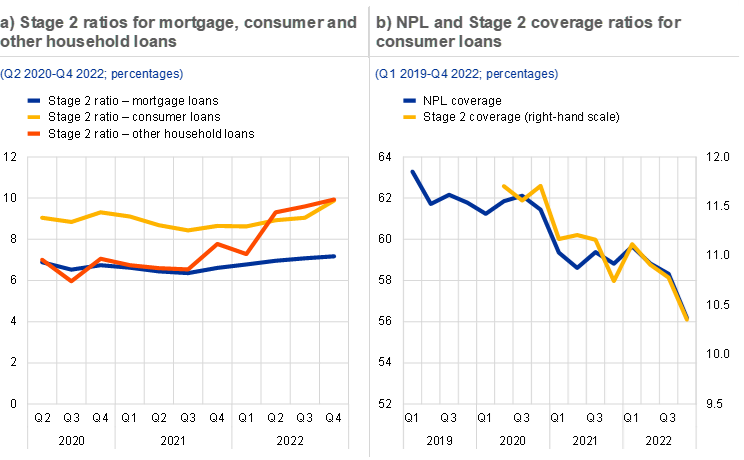
Sources: ECB and ECB calculations.
Note: Stage 2 ratios are based on data for 93 IFRS-reporting significant institutions.
Box 5
IFRS 9, accounting discretion and provisioning behaviour around credit events
The aim of International Financial Reporting Standard 9 (IFRS 9) is to improve the recognition of banks’ credit losses, but its implementation has triggered discussions about potential side effects.[38] IFRS 9 was adopted in 2018 to introduce a more forward-looking estimation of credit losses and a loan-staging approach that more accurately captures the level of risk. The general goal was to increase transparency and to tackle the “too little, too late” problem of previous accounting principles that were criticised after the global financial crisis.[39] However, there have been concerns that an undue interpretation of the approach may imply significant increases in provisioning at the onset of a shock (“cliff effects”), where the corresponding erosion of capital may prompt banks to cut lending at the worst moment for the economy (procyclicality). There have also been fears that less well-capitalised banks could exploit the discretion associated with reliance on internal provisioning models to provision less and avoid further reductions in capital, which would conflict with the objective of transparency.
More4 Non-bank financial sector
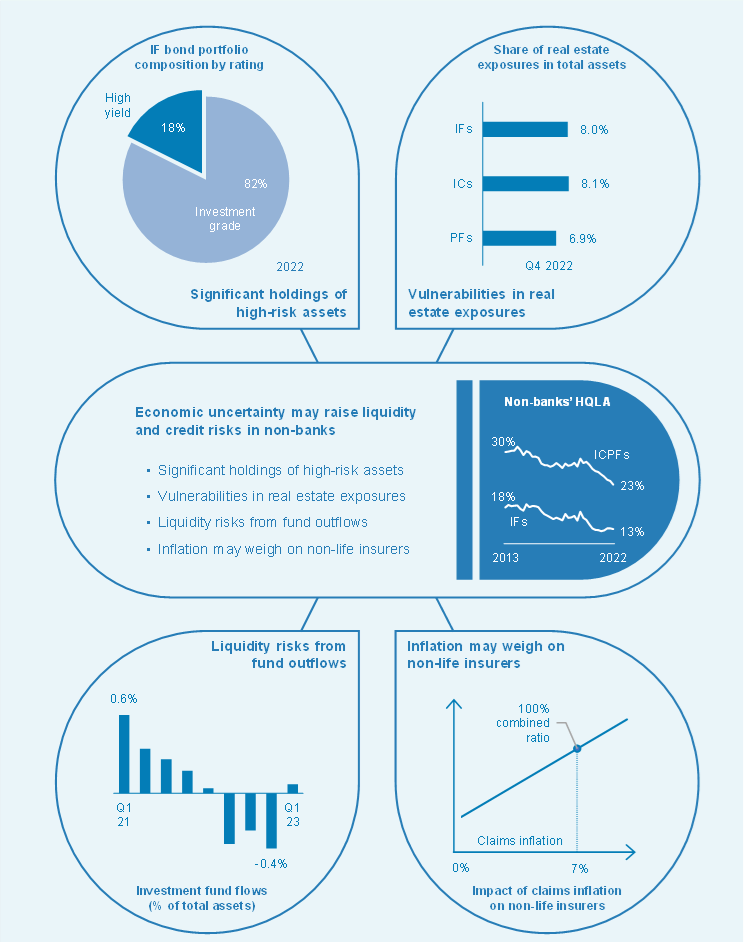
4.1 Despite de-risking, the NBFI sector remains vulnerable amid macroeconomic uncertainty and volatile markets
Non-bank financial institutions have continued to reduce credit risk while remaining supportive of corporate debt markets. In the context of rising interest rates, the non-bank financial intermediation (NBFI) sector has further reduced its exposure to lower-rated securities. During 2022 the sector expanded its share of AAA, AA and A-rated securities in bond portfolios, while reducing its share of high-yield assets (Chart 4.1, panel a). As a result, exposure to credit risk declined, especially in the investment fund sector, reversing the search-for-yield behaviour observed during the low interest rate environment of previous years (Section 4.2). The NBFI sector nevertheless remained active in purchasing new debt issued by non-financial corporations (NFCs). It increased both the absolute amount of higher-rated bonds purchased and its share in the total issuance across all categories of credit quality, absorbing more than 50% of newly issued NFC debt in 2022 (Chart 4.1, panel b). This highlights the importance of the sector’s role in financing the real economy, even in a challenging market environment where NFCs have increasingly turned towards bank financing (Box 6).
Chart 4.1
The NBFI sector continued to reduce credit risk in its portfolios in 2022 while supporting NFC bond issuance
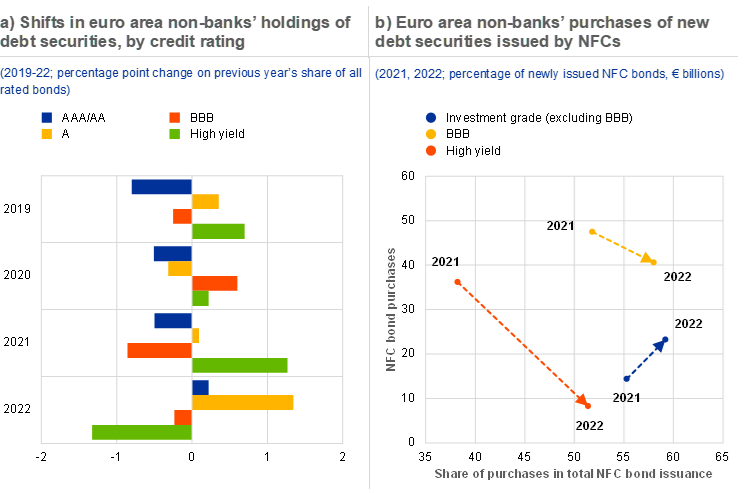
Sources: ECB and ECB calculations.
Notes: Non-banks include investment funds, insurance corporations and pension funds. Panel a: all issuer sectors are included. Changes in holding composition are calculated as the percentage point change in the share of holdings by rating in total holdings, excluding securities of unrated issuers, and relative to the previous year-end. The worst rating is chosen in the event of multiple ratings. Panel b: newly issued debt securities are defined as all bonds issued by euro area NFCs during the same year. Short-term bonds and purchases by money market funds are excluded. NFC stands for non-financial corporation.
Box 6
Corporate loans versus market-based finance: substitutes or complements?
The financing structure of firms has changed markedly over the last few decades as capital markets and non-bank financial intermediaries have evolved.[40] Bond markets became an important source of credit for firms following the deleveraging of banks after the global financial crisis and the launch of the Eurosystem’s asset purchase programme. As of the third quarter of 2022, they channelled around 20% of total credit to euro area non-financial corporations (NFCs). This box investigates whether or not banks step in when market-based credit declines in the face of increased market volatility and rising interest rates. While large and better-rated firms would benefit the most from such a substitution, smaller and riskier firms may find it harder to access credit as their ability to tap bond markets is more limited and they are more reliant on bank loans.
MoreThe NBFI sector remains vulnerable to price corrections, given macroeconomic uncertainty, volatile markets and a turning real estate cycle. Despite the recent decline, credit risk in NBFI sector portfolios continues to be elevated and may rise against a backdrop of prevailing recession risk and high inflation (Chapter 1). The sector may therefore face (revaluation) losses from rising risk premia and potential increases in the probability of firm defaults. In the event of sudden liquidity needs, forced asset sales might amplify price pressures, emphasising the importance of sufficient liquidity preparedness across the broader NBFI sector and appropriate redemption terms for funds investing in relatively illiquid assets (Chapter 5). Revaluation losses in the sector could also arise from a downturn in real estate markets (Chapter 1 and Box 2). Real estate investment funds (REIFs) have grown considerably over recent years. At the end of 2022, investment funds, insurance corporations and pension funds held 8.0%, 8.1% and 6.9% respectively of their total assets in real estate and REIFs (Chart 4.2, panel a, Sections 4.2 and 4.3).[41]
Chart 4.2
The NBFI sector remains vulnerable to corrections in real estate and financial markets
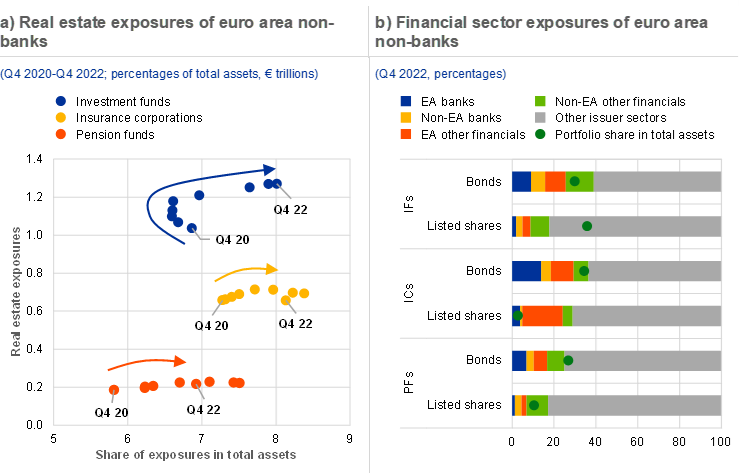
Sources: EIOPA, ECB and ECB calculations.
Notes: Panel a: real estate exposures are proxied by real estate investment funds’ assets for investment funds, and investments in real estate and real estate investment funds for insurance corporations and pension funds. Panel b: data are in market values. Portfolio shares indicate the percentage of total assets invested in bonds or listed shares respectively. EA stands for euro area; IFs stands for investment funds; ICs stands for insurance corporations; PFs stands for pension funds.
Interconnectedness between the NBFI and banking sectors can also give rise to vulnerabilities and financial contagion risks. Investments in banks and other financial sectors can expose non-banks to spillovers from other financial entities. Given its holdings of bank-issued debt and listed shares, the NBFI sector is also an important source of funding for banks (Chart B.3, panel a in Special Feature B and Chart 4.2, panel b). In particular, the investment fund sector holds almost all contingent convertible bonds issued by banks, even though such holdings comprise only 0.2% of total investment fund assets. The various direct and indirect interlinkages between different parts of the financial system can lead to spillovers in liquidity and credit risks, potentially serving to amplify asset price movements (Special Feature B). Pre-emptive measures, in the form of adequate liquidity buffers for instance, can both strengthen the resilience of the NBFI sector against spillovers and mitigate the risk of further financial contagion.
4.2 Investment funds remain vulnerable to liquidity risk in a challenging market environment
Amid recent elevated uncertainty and financial market volatility, investment funds exposed to relatively risky assets have faced significant investor outflows, while inflows into sovereign bond funds have accelerated. Following the banking sector stress seen in the United States and Switzerland in early March, high-yield funds have experienced significant outflows, while flows into funds focused on investment-grade corporate bonds have remained broadly unaffected. In parallel, inflows into sovereign funds have accelerated, reflecting investor de-risking (Overview, Chart 3, panel a). The banking sector stress also caused funds invested in the European financial sector to experience net outflows (Chart 4.3, panel a). Significant outflows from such investment funds may trigger sales of securities issued by banks and other financials. This could amplify the negative impact of price pressures on bank funding markets, as the non-bank financial intermediation (NBFI) sector is an important source of funding for euro area banks (Section 4.1 and Special Feature B). In addition, money market funds (MMFs) have experienced net inflows since early March, especially in the United States (Chart 4.3, panel b). This may reflect an increase in MMF returns, with investors seeking a safe haven amid elevated macro-financial uncertainty and – in the United States – heightened concerns over uninsured deposits in the banking sector.
Chart 4.3
Banking sector stress in the United States and Switzerland precipitated outflows from equity funds focusing on financials and inflows into money market funds
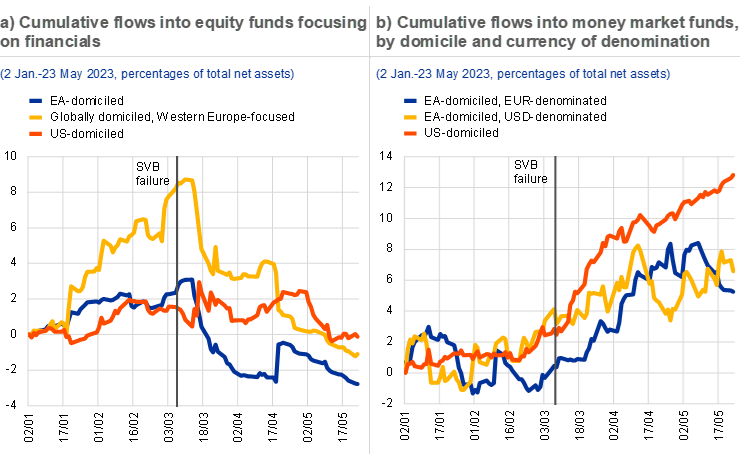
Sources: EPFR Global and ECB calculations.
Notes: EA stands for euro area; SVB stands for Silicon Valley Bank.
In recent quarters, euro area investment funds have continued to reduce their exposure to credit risk by selling high-yield securities and purchasing investment-grade bonds. Investor shifts towards comparatively safer investment funds led to an increase in funds’ overall holdings of sovereign and investment-grade corporate bonds, as well as sales of lower-rated corporate bonds, in the fourth quarter of 2022 (Chart 4.4, panel a). This has contributed to a reduction of investment funds’ exposure to credit risk. Should such de-risking continue, however, it could put pressure on high-yield bonds and make issuance more challenging.
Chart 4.4
Investment funds continue to de-risk, while real estate funds’ net asset values and returns decline
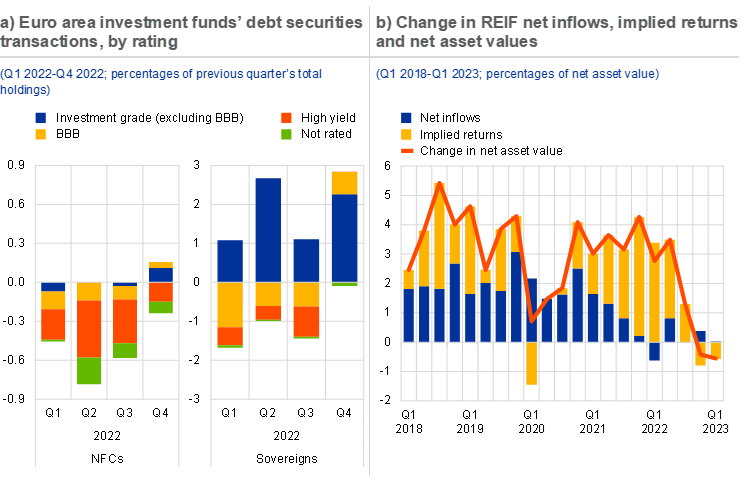
Sources: ECB and ECB calculations.
Notes: Panel a: unrated holdings are excluded. NFCs stands for non-financial corporations. Panel b: implied returns are calculated as the difference between the change in net asset value and net inflows into real estate investment funds (REIFs).
Property funds face particular challenges in the current environment. Falling values of commercial real estate assets caused the total assets of real estate investment funds (REIFs) to decline in the fourth quarter of 2022 – for the first time since the global financial crisis (Chart 4.4, panel b). Moreover, net inflows into REIFs have been falling since the fourth quarter of 2020, with implied returns decreasing over the past two quarters. In this context, REIFs could face larger outflows in the future. Rising liquidity pressures could potentially lead to forced asset sales and amplify corrections in real estate markets (Section 4.3 and Box 2), particularly in countries where REIFs have a large market footprint.[42]
Despite the recent de-risking, liquidity and credit risks in investment funds could materialise should macroeconomic conditions deteriorate and market volatility increase. The share of high-quality liquid assets held by the euro area investment fund sector remained broadly stable in 2022, but – at 13% of total holdings – remains well below the average of 17% observed between 2014 and 2020 (Overview, Chart 3, panel b). Cash holdings by equity and bond funds remain low, especially in the context of elevated financial market volatility and sizeable redemptions seen in 2022 (Chart 4.5, panel a).[43] In an adverse scenario, relatively small cash buffers could lead investment funds to engage in procyclical selling behaviour, potentially amplifying market corrections.[44] Credit risk for investment funds also remains elevated, despite declining in the past two years. Since late 2020, the investment fund sector’s shares of holdings of high-yield bonds and BBB-rated bonds have declined by 2 and 3 percentage points respectively, while holdings of higher-rated bonds have increased. Nonetheless, the combined share of BBB-rated and high-yield assets among all bond holdings was still close to 50% at the end of 2022 (Chart 4.5, panel b). Thus, in the face of recession risks and tightening financial conditions, investment funds could suffer losses associated with credit risk and asset price revaluations, especially in lower-rated segments. This could cause surges in outflows and forced asset sales. For investment funds using derivatives for hedging purposes, these effects may be amplified by asset sales to meet margin calls (Box 7). In the light of these risks, and given the relevance of investment funds as a source of funding to non-financial corporations and the banking sector, there is a need to strengthen the resilience of the sector and tackle issues related to structural liquidity mismatch (Chapter 5).
Chart 4.5
Investment funds remain vulnerable to liquidity and credit risks
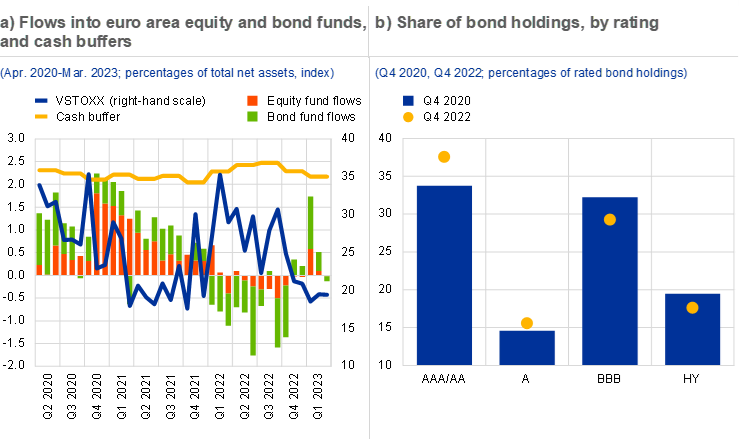
Sources: ECB, EPFR Global and ECB calculations.
Notes: Panel a: VSTOXX and flows are monthly data until March 2023. Cash buffers are at a quarterly frequency, the latest available observation being for March 2023 (Q1 2023). The cash buffer is calculated as the sum of cash holdings of euro area equity and bond funds in these funds’ total assets. Panel b: total euro area investment funds’ bond holdings as a share of total holdings of rated bonds, by rating category. HY stands for high yield.
4.3 Insurers remain resilient, but rising economic uncertainty could pose challenges
Euro area insurers maintained robust profitability and solvency positions in the second half of 2022. Insurers continued to perform well in the second half of 2022, despite high inflation. Aggregate profitability – as measured by return on equity – increased rapidly (Chart 4.6, panel a), supported by strong underwriting results. Solvency Capital Requirement ratios fell marginally in the final quarter of 2022, but remain strong at over 200% on average (Chart 4.6, panel b), thanks mainly to the net positive effects of rising interest rates on life insurers’ balance sheets. At the same time, rising dispersion in the combined ratio (i.e. claim-related losses and expenses divided by premiums earned) in the second half of 2022 may point to reduced underwriting profitability for some non-life insurers (Chart 4.6, panel c).
Chart 4.6
Insurers’ profitability and solvency remain generally strong
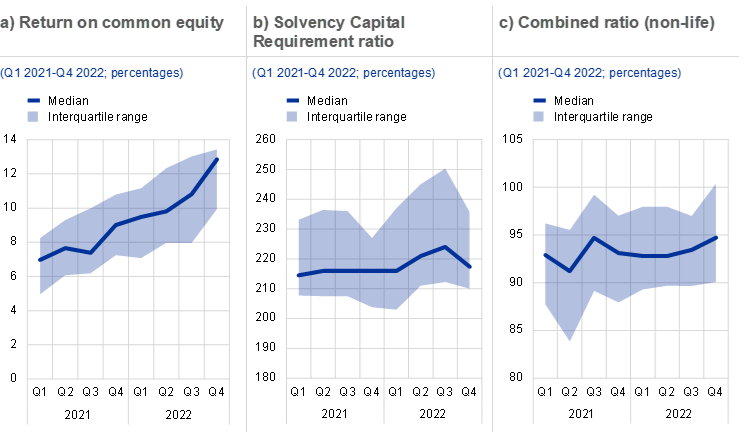
Sources: Bloomberg Financial L.P. and ECB calculations.
Notes: Data are based on a sample of large euro area insurers offering life and non-life products. The combined ratio is a common measure of non-life insurance profitability and is calculated as claim-related losses plus expenses divided by net premiums earned.
Life and non-life insurers face different challenges stemming from rising uncertainty and inflation. Following the banking sector stress in the United States and Switzerland in mid-March, insurers’ stock prices declined sharply, driven by broader market sentiment. This is despite insurers’ limited exposures to bank bonds and equity relative to their total assets (Section 4.1, Chart 4.2, panel b). Insurers’ equity prices have largely recovered since then, except in the life insurance sector (Chart 4.7, panel a). In part, this may reflect rising economic uncertainty, as slower growth and high inflation could have negative repercussions in the life sector. Declining real household incomes could reduce future demand for new life policies, while policy lapses could become more widespread.[45] In addition, early redemptions of traditional savings products by policyholders could also weigh on life insurers’ profitability. In particular, the potential for early redemptions may increase as interest rates rise, given that policyholders may seek to reinvest in new contracts offering higher returns.
Chart 4.7
Rising uncertainty could have implications for the future profitability of insurers
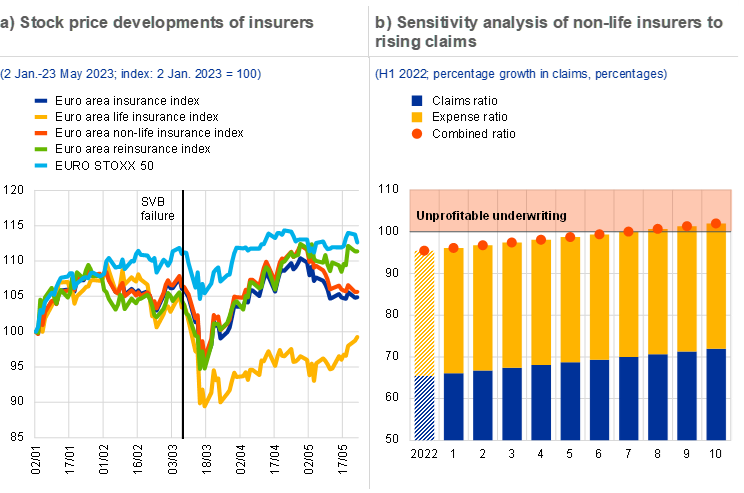
Sources: Refinitiv, EIOPA and ECB calculations.
Notes: Panel a: the chart shows daily observations. SVB stands for Silicon Valley Bank. Panel b: the chart shows the increase in claims ratios and combined ratios stemming from an increase in claims of 1% to 10%, based on H1 2022 data. The claims ratio is calculated as claims incurred divided by net premiums earned, the expense ratio is calculated as expenses divided by net premiums earned, and the combined ratio is calculated as claims plus expenses divided by net premiums earned.
Non-life insurers are particularly exposed to claims inflation.[46] As is the case with life insurers, slower economic growth could pose a challenge to non-life (re)insurers through falling demand for new policies and increasing numbers of policy lapses. In addition, non-life insurers are exposed to claims inflation (i.e. increases in the nominal value of claims), which may weigh on their profitability. This is particularly the case where they face difficulties in raising prices to keep pace with inflation. A significant rise in the nominal value of claims would increase non-life insurers’ claims ratios (i.e. the ratio of claims incurred to premiums earned) which could, in turn, push their combined ratios (i.e. claim-related losses and expenses divided by premiums earned) above the threshold required for profitable underwriting (Chart 4.7, panel b).
The resilience of insurers and pension funds may benefit from rising interest rates in the medium term. Gradually rising interest rates generally have a positive impact on the capital positions of life insurers. This effect tends to be more material for insurers with larger negative duration gaps and with an elevated share of traditional life policies in their back-books. This is because insurers can invest the premiums earned on these policies at a higher return than was previously the case. Given that the guaranteed returns to policyholders remain unchanged, such rising returns may result in a net gain for the insurer. By contrast, rising returns on investments through unit-linked investment policies benefit solely policyholders and not the insurer.[47] A gradual increase in yields may also lead to greater demand for higher-quality bonds from insurance corporations and pension funds (ICPFs), as seen in recent quarters (Section 4.1). This may help to lower credit risk for ICPFs and alleviate concerns regarding the absorption of future issuances of sovereign bonds (Box 3), although it could contribute to funding challenges for higher-yielding non-financial corporations going forward (Chapter 2). At the same time, rising interest rates may result in valuation losses on portfolio holdings. Moreover, a sharp increase in yields, or a spike in financial market volatility, could expose ICPFs with interest rate derivative exposures to large margin calls. Recent stress events (such as the March 2020 financial market turmoil and the UK gilt market episode) demonstrate how liquidity pressures faced by ICPFs can propagate stress to other markets. This underscores the importance of strengthening liquidity preparedness to meet margin calls (Section 4.1, Chapter 5 and Box 7).
Chart 4.8
ICPFs could be exposed to losses on real estate holdings
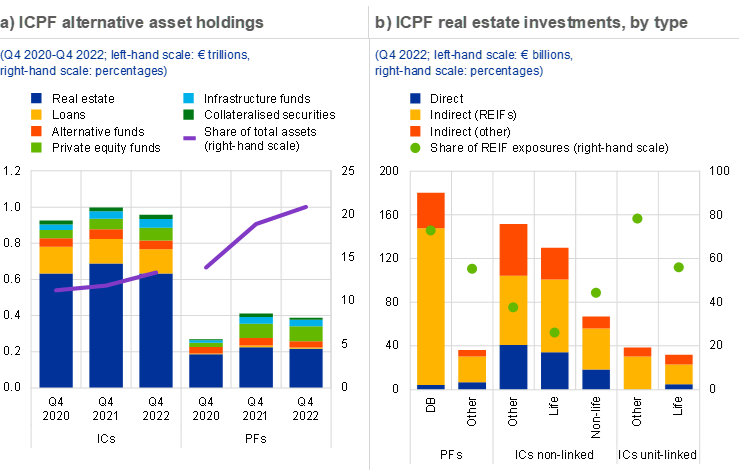
Sources: EIOPA and ECB calculations.
Notes: The charts are based on aggregate asset exposure statistics published by EIOPA. ICs stands for insurance corporations; PFs stands for pension funds. Data on pension funds reflect occupational pension schemes only. Panel a: the “Real estate” category includes exposures to residential and commercial properties (excluding those for own use), mortgages, corporate bonds and the equity of real estate-related corporations and real estate funds. Panel b: direct and indirect exposures to real estate exclude mortgages. For insurers, “Other” includes real estate holdings where the insurer type is unknown, as well as holdings by other insurer types (e.g. reinsurers). For pension funds, “Other” includes holdings by pension funds where the scheme type is unknown, as well as defined contribution schemes. DB stands for defined benefit; REIFs stands for real estate investment funds.
ICPFs could be exposed to losses from ongoing corrections in real estate markets or could add to liquidity pressures for real estate investment funds (REIFs). In the low interest rate environment of the past decade that came to an end last year, ICPFs significantly increased their holdings of alternative, less liquid assets, especially real estate (Chart 4.8, panel a). While ICPF real estate exposures declined in value in 2022, their share of total assets actually increased on account of the falling valuations of other asset classes (i.e. securities and equities). Nonetheless, commercial real estate (CRE) prices have fallen as financial conditions have tightened (Chapter 1) and remain at risk of further correction. ICPFs generally have indirect exposure to real estate, mainly in the form of shares in euro area REIFs and other listed real estate companies (Chart 4.8, panel b). Further corrections in CRE markets would increase potential redemption pressures for, and forced sales by, REIFs (Section 4.2). Such scenarios would result in losses for investors in REIFs, including ICPFs. Equally, ICPFs could also contribute to growing liquidity pressures faced by REIFs. Further corrections in CRE markets would generally affect ICPF balance sheets, rather than their policyholders and beneficiaries, given that their exposures are mainly via non-unit-linked products or defined benefit pension schemes. This could incentivise ICPFs to rebalance their portfolios away from CRE, including divestment from REIFs. In the context of corrections in real estate markets, interconnectedness within the NBFI sector, as well as with the banking sector, warrants ongoing monitoring.
5 Macroprudential policy issues
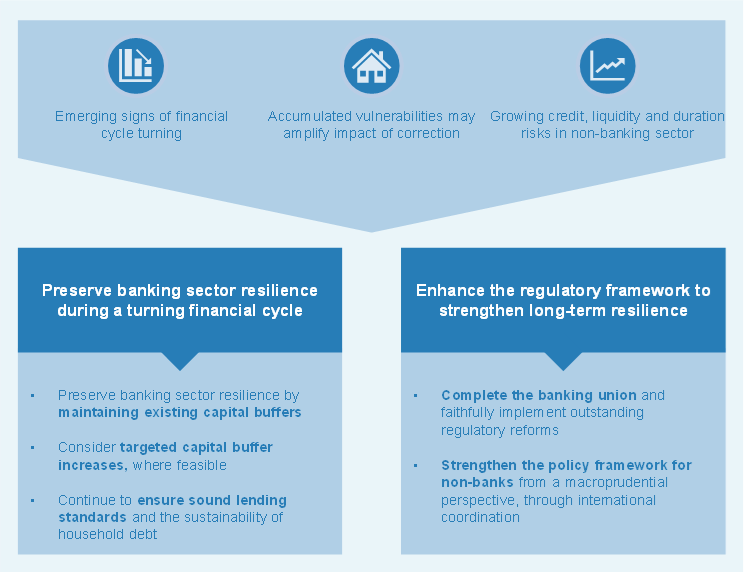
5.1 Preserving banking sector resilience during a turning financial cycle
The euro area banking sector demonstrated great resilience during both the pandemic and Russia’s initial invasion of Ukraine, and continued to provide key financial services to the real economy. Euro area banks continue to enjoy comfortable capital and liquidity positions (Chapter 3), indicating that they are well placed to withstand adverse shocks.
Macroprudential policy action taken since the pandemic has further increased the financial system’s resilience to adverse shocks. Despite the challenges induced by a highly uncertain geopolitical and economic environment, the authorities have followed up on the lessons learnt from the pandemic and have made more active use of the countercyclical capital buffer (CCyB), including by introducing a positive neutral rate.[48] Specifically, 12 countries have now activated the CCyB, increasing its weighted average rate in the banking union to 0.56%[49] in the fourth quarter of 2022 (Chart 5.1, panel a). Through these actions, the authorities have addressed existing vulnerabilities and have enhanced their capacity to make capital available by releasing the accumulated buffers when necessary. In this vein, several countries have increased sectoral capital buffers to address vulnerabilities related to residential real estate (RRE). These actions complement the significant RRE-related policy measures taken before the pandemic, which comprised both capital-based measures to enhance bank resilience and borrower-based measures to address flow risks in relation to exuberant real estate dynamics and deteriorating lending standards.[50]
Chart 5.1
Macroprudential policy measures have further increased banking sector resilience, while the financial cycle appears to be turning
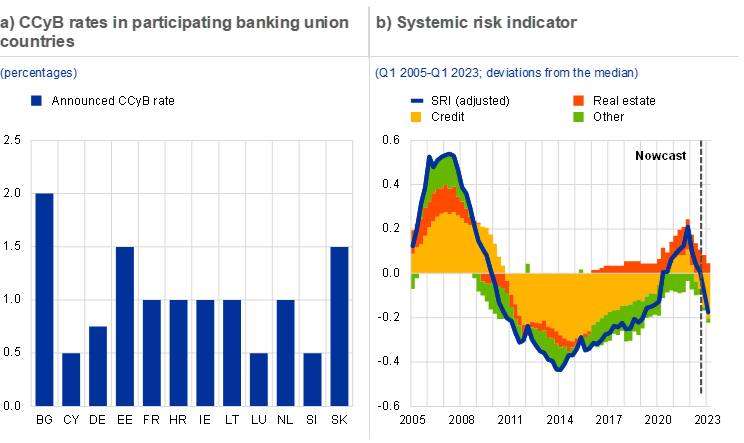
Sources: Notifications from national authorities, Eurostat, ECB and ECB calculations.
Notes: Panel a: current announced rates for the CCyB, as notified to the ECB by national authorities. The announced rate is already effective in Germany and Luxembourg, while in other countries it will become effective in the course of 2023 (2024 in France), one year after the announcement date. Panel b: the systemic risk indicator (SRI) measures the build-up of vulnerabilities from credit developments, real estate markets, asset prices and external imbalances; it has better early warning properties for financial crises in European countries than the Basel credit-to-GDP gap. The SRI is based on Lang et al.* “Credit” includes the contributions of the two-year change in the bank credit-to-GDP ratio and the two-year growth rate of real total credit; “Real estate” denotes the contribution of the three-year change in the price/income ratio for residential real estate; “Other” includes the contributions of the current account-to-GDP ratio, the three-year change in real equity prices and the two-year change in the debt-service ratio. The latest observations are for Q3 2022. Nowcasts are based on data from the March 2023 ECB staff macroeconomic projections.
*) Lang, J.H., Izzo, C., Fahr, S. and Ruzicka, J., “Anticipating the bust: a new cyclical systemic risk indicator to assess the likelihood and severity of financial crises”, Occasional Paper Series, No 219, ECB, February 2019.
The current environment, which combines elevated uncertainty with existing vulnerabilities and signs of a turning financial cycle, poses challenges for macroprudential policy. Against a background of low growth, high inflation and rising interest rates, there are already clear signs that the financial cycle is turning. These are particularly evident for the real estate sectors, where mortgage credit and house price dynamics have decelerated as of late and commercial real estate markets have entered a downturn (Chapter 1.5), while broader cyclical indicators such as the systemic risk indicator (SRI) are projected to decline further over the next few quarters (Chart 5.1, panel b). Nevertheless, vulnerabilities arising from high private sector indebtedness and house price overvaluation remain elevated in several banking union countries. Such vulnerabilities may amplify the effects of falling incomes, higher borrowing costs and real estate price corrections. Moreover, although banks and households are resilient overall, the likelihood of risk materialising has increased, as illustrated by the recent banking sector turmoil. In such an environment, it is of the utmost importance for macroprudential authorities to monitor developments closely and adjust their course of action when necessary.
In this context, macroprudential policy should continue to focus on ensuring that the financial system is resilient and that it remains able to withstand adversity while continuing to provide key services to the real economy. While there are some indications that credit supply is tightening on the back of perceived greater risk and higher funding costs, capital requirements are not a constraining factor as banks continue to exhibit sizeable capital headroom. The existing macroprudential capital buffers should therefore be maintained to preserve banking sector resilience, given that the conditions for their release are not yet in place. Moreover, notwithstanding the macroprudential measures that have recently been implemented, targeted increases in capital buffer requirements might still be considered in some countries. In countries with a framework that features a positive neutral rate for the CCyB, for example, building up the buffer towards the target rate would be welcome, provided that procyclical effects are avoided. The risk of the latter occurring continues to be mitigated by the existing capital headroom and a robust profitability outlook in the baseline scenario. At the same time, as downside risks have increased, banks should refrain from increasing payout ratios further and should instead focus on preserving their existing strong resilience. Finally, borrower-based measures under the remit of national authorities should continue to ensure that lending standards are sound and that household debt is sustainable, in a framework where capital-based and borrower-based measures complement each other. Existing borrower-based measures in the banking union are mostly calibrated as structural backstops and often incorporate flexibility in the form of exemptions or less stringent limits for specific types of borrowers, which may be used to guarantee the continued availability of credit while at the same time ensuring that lending standards remain sound. Where not yet in place, borrower-based measures could be introduced as structural backstops to preserve debt sustainability and promote sound lending standards, provided that procyclical effects are avoided.
Further strengthening of the robust and comprehensive EU regulatory framework for banks
The recent turmoil in the US and Swiss banking sectors highlighted the benefits of the broad and consistent application in all jurisdictions of global regulatory reforms introduced after the global financial crisis. The recent banking sector stresses in the United States and Switzerland further underline the importance of adequate capitalisation, appropriate liquidity levels and the transparent accounting of risks on bank balance sheets. To this end, the Basel Committee on Banking Supervision has agreed to take stock of the regulatory and supervisory implications of recent events, with a view to learning lessons. The Financial Stability Board has agreed to review the lessons learnt from the recent measures taken by the authorities to resolve financial institutions for the operation of the international resolution framework.
Although the bank regulatory framework is robust and widely applied in the EU, the full, faithful and timely implementation of outstanding regulatory reforms will help by strengthening the resilience of the European banking system still further. In the EU, the international standards set by the Basel Committee on Banking Supervision, to the extent that they have already been transposed into EU law, are applied to all EU banks irrespective of size. All EU significant institutions are stress-tested by the ECB at least once a year. Every other year they are stress-tested in cooperation with the European Banking Authority as part of the EU-wide stress test, with additional “thematic” stress tests conducted in the “off years”. Given recent banking tensions, the full, faithful and timely implementation of outstanding Basel III elements will ensure that banks continue to be well-capitalised. It will also foster trust in the EU banking system and provide additional levers for supervisory scrutiny.[51] The EU should strive, consistently with other major jurisdictions, to ensure that the outstanding Basel III standards enter into force by the agreed deadline of January 2025.
The recent surge in global financial stability risks is also a reminder to complete the banking union, and this should be a key priority for legislators in the coming months. Although there are instruments in place to address risks, minimise the likelihood of bank failures and manage such failures when they do occur, the European Commission’s proposal on crisis management and deposit insurance published on 18 April 2023 offers some very welcome ideas for further improving the framework, for example by making it suitable for a broader set of banks.[52] This could be achieved by introducing a general depositor preference which would rank all deposits equally in the creditor hierarchy, for example, or by improving access to the Single Resolution Fund. The Commission’s proposal should be swiftly advanced by co-legislators so that agreement can be reached within the current institutional cycle. The establishment of the common backstop to the Single Resolution Fund, which will require all EU Member States to ratify the amended European Stability Mechanism Treaty, is another important way to further strengthen the bank resolution framework. In addition, the swift introduction of a European deposit insurance scheme is warranted to enhance depositor confidence and represents a key step towards completing the banking union. Finally, work should continue on liquidity in resolution to address possible liquidity shortfalls for those banks that, despite being recapitalised, still face a shortage of liquidity after resolution.[53]
Recent banking sector tensions in Switzerland have turned the spotlight onto the functioning of Additional Tier 1 (AT1) instruments and the design of their contractual triggers. In the context of the acquisition of Credit Suisse by UBS on 19 March 2023[54], the Swiss authorities also announced the planned write-down of Credit Suisse Group’s AT1 instruments, whereby the write-down was to take place before the equity capital of the bank had been completely used up or written down.[55] In the EU, prudential regulation only requires the terms and conditions of AT1 instruments to include an automatic loss-absorption mechanism that can take the form of either a write-down (permanent or temporary) or a conversion triggered by the CET1 ratio falling below a contractually agreed threshold (which must be at least 5.125%). EU law does not require capital instruments to have permanent contractual write-down clauses that would be automatically activated if a bank were to receive public support.
The EU resolution framework has established a detailed sequence representing the order in which the shareholders and creditors of a troubled bank should bear losses. The EU resolution framework requires a write-down to follow a specific sequence which assumes that common equity instruments will absorb losses first, and only after these have been fully used will AT1 instruments be written down. ECB Banking Supervision, the Single Resolution Board and the European Banking Authority recently reiterated the fact that this sequence has been consistently applied in past cases and will continue to guide the actions of the Single Resolution Board and ECB Banking Supervision in crisis interventions.[56]
5.2 Enhancing resilience in the non-bank financial sector
Persistent structural vulnerabilities and the risk of renewed stress make it vital to enhance the resilience of the non-bank financial sector. Priority should be given to policies which reduce liquidity mismatch in money market and investment funds, tackle risks arising from financial and synthetic leverage across the non-bank financial intermediation (NBFI) sector and enhance liquidity preparedness across a broad range of institutions, especially in relation to margin calls. International policy initiatives are key in this regard, given the pronounced cross-border dimension of NBFI activities, and the Financial Stability Board (FSB) has pursued (or will pursue) policy work in all of these areas.[57] But as it will take time for regulatory reforms to be agreed internationally and implemented, authorities regulating and supervising NBFI entities should pay close attention to vulnerabilities in the sector and take an active role in strengthening resilience, within their mandate and existing policy frameworks.
Policy proposals for money market fund (MMF) reforms should be implemented as soon as possible. Following the pandemic-related market turmoil of March 2020, proposals to enhance the resilience of MMFs without unduly curtailing their economic function were developed at both the international and the European level. Such policy proposals focused on removing regulatory threshold effects, strengthening MMF liquidity requirements and improving the availability and usability of liquidity management tools.[58] In the EU, however, reform of the Money Market Fund Regulation has seen no progress to date but should be pursued as a matter of priority, while ensuring consistency with the international approach.
It is important to strengthen the liquidity management practices of open-ended funds (OEFs). In 2022, the FSB assessed the effectiveness of its 2017 recommendations on liquidity mismatch in OEFs.[59] The FSB analysis suggested that there has been no measurable reduction in the degree of structural liquidity mismatch since the recommendations were issued. The FSB concluded that while its recommendations remained broadly appropriate, “enhancing clarity and specificity on the intended policy outcomes the FSB Recommendations seek to achieve would make them more effective from a financial stability perspective.” Specifically, the daily creation and redemption of fund shares would remain appropriate for funds that mainly invest in assets that are liquid during normal as well as stressed periods (e.g. certain listed equities or government bonds). For funds invested in assets that are less liquid during normal periods but which could become illiquid under stress, such as corporate bond funds, daily dealings may be appropriate if the asset manager can demonstrate to the authorities that higher standards of liquidity management are being met. However, the asset manager should consider longer notice periods or a lower redemption frequency to reduce liquidity mismatch vulnerability, if the costs of selling assets cannot be passed on to redeeming investors by anti-dilution measures. Finally, it would not be appropriate for open-ended funds holding a significant share of assets (such as real estate) that are illiquid even under normal market conditions to offer daily liquidity to investors. In this regard, national regulators and authorities supervising property funds in the EU have devised a range of policy measures.[60] For example, in Germany the minimum notice period for property funds is 12 months and the minimum holding period is 24 months,[61] while the Central Bank of Ireland has recently introduced a minimum liquidity time frame of at least 12 months, consisting of the notice period plus the settlement period.[62] In Italy, real estate funds are structured as closed-end funds that limit investors’ rights to redeem their units.
Price-based liquidity management tools can usefully complement – but not replace – measures that better align asset liquidity with redemption terms. Enhancing the availability and use of anti-dilution liquidity management tools should form part of the policy response to vulnerabilities in the OEF sector. In particular, OEFs should be able to pass on to redeeming investors the explicit and implicit costs of selling assets under both normal and stressed market conditions. This could be achieved by employing price-based anti-dilution tools, such as swing pricing or anti-dilution levies, which could help mitigate first-mover advantages.[63] However, if the swing factors or levies are not appropriately calibrated or capped, they cannot effectively mitigate first-mover incentives.[64] Price-based liquidity management tools may also be difficult to use in stressed market conditions when liquidity has dried up and price information may be missing or distorted. Therefore, to avoid withdrawals causing liquidity strains during such periods, it is important to ensure that asset liquidity is commensurate with redemption terms.[65] In particular, as discussed above, longer notice periods might be warranted for funds investing in less liquid assets, and higher liquidity buffers might be needed for funds offering daily redemptions.
Recent stress episodes and the associated liquidity challenges have underlined the need to reduce procyclicality by enhancing margining practices as well as the NBFI sector’s liquidity preparedness to meet margin and collateral calls. Since the March 2020 market turmoil, the NBFI sector has repeatedly faced periods of high market volatility and surging liquidity needs arising from margin and collateral calls (Box 7). The higher margin calls were intended to protect central counterparties (CCPs) and market participants from heightened counterparty exposure in the face of high price volatility in underlying markets. It is, however, important to reduce procyclical demand for liquidity arising from margining practices by increasing the transparency and predictability of initial margin models and by assessing their responsiveness to market stress.[66] In addition, these episodes also exposed vulnerabilities arising from inadequate liquidity preparedness to meet margin and collateral calls. Enhancing the NBFI sector’s liquidity preparedness should include ensuring that liquidity risk management and contingency planning frameworks are robust, while the challenges posed by relying on the same sources of liquidity as other players during periods of stress should be considered. Given the interplay between leverage and liquidity risk arising from margin and collateral calls, addressing the risks associated with NBFI sector leverage would help to reduce the risk of inadequate liquidity preparedness. Finally, the policy work carried out on margining should be complemented by strengthening the global risk assessment, for instance, by enhancing information sharing of derivatives data across jurisdictions and tackling data gaps.
Box 7
Non-banks’ liquidity preparedness and leverage: insights and policy implications from recent stress events
Recent stress episodes have shown how non-bank financial institutions can amplify stress in the wider financial system when faced with sudden increases in margin and collateral calls (Table A). The March 2020 market turmoil, tensions in commodity markets in 2022 and, most recently, stress in the UK government bond (gilt) market in September 2022 revealed non-bank financial intermediation (NBFI) vulnerabilities associated with rapid surges in margin and collateral calls. The resulting spikes in the demand for liquidity and/or deleveraging pushed some NBFI entities towards disorderly asset sales or large cash withdrawals, from money market funds for instance, with spillovers to other financial institutions or markets. In several cases, extraordinary policy responses by public authorities and central banks helped to stabilise markets and limit contagion. This box examines two of the key vulnerabilities – excessive leverage and inadequate liquidity preparedness to meet margin calls – and discusses policy implications for enhancing the resilience of the NBFI sector.
MoreProposals to make the clearing system in the EU safer are currently being developed and include measures to enhance model transparency and reduce excessive reliance on CCPs based outside the EU. European Commission proposals included in its capital markets union package aim to make EU clearing safer and more resilient.[67] Measures such as enhancing transparency and reducing the impact of intraday margins are in line with international efforts to improve margining practices. The proposals also include measures aimed at reducing excessive exposure to Tier 2 CCPs.[68] An example of this is an active account requirement which would require EU market participants to clear a portion of their derivatives through active accounts at EU CCPs.[69] The active account will need to be carefully calibrated if the requirement is to sufficiently reduce tail risks stemming from third-country Tier 2 CCPs. In addition, the calibration will need to take account of any potential negative effects on financial stability and market liquidity for EU market participants, for which it will be important to allow an adequate phase-in period.
Given the complexities involved in the use of leverage in an interconnected financial system, a policy response needs to take a holistic perspective across NBFI sector entities and activities. A key priority for the FSB should be to develop a globally consistent approach for addressing risk deriving from either financial or synthetic leverage in the NBFI sector. For this purpose, it is important for work to continue on globally consistent metrics, on improving data quality and coverage, as well as on information-sharing to assess leverage-related risks across NBFI sector entities and activities. Such work should be complemented by identifying gaps in policy frameworks globally, especially where financial entities are not subject to adequate leverage rules. The provision of leverage through banks and broker-dealers, including via repo transactions, should be considered as part of a holistic approach to NBFI sector leverage. The policy response should also consider how haircuts and margining in derivatives markets disincentivise excessive leverage in the NBFI sector, while it should also take into account the potential negative impact on the propensity to hedge for end users. Where leverage rules are already part of regulatory frameworks, as is the case for investment funds in the EU, consideration should be given to whether existing rules should be enhanced from a financial stability perspective. Moreover, supervisors of NBFI sector entities should actively identify excessively leveraged institutions and tackle the resulting risk. This could be achieved by requiring more severe stress test scenarios, for example, or by imposing leverage limits, as provided for under the European Alternative Investment Fund Managers Directive.[70]
5.3 Other ongoing policy initiatives that support euro area financial stability

Notes: *See “Governing Council statement on macroprudential policies”, ECB, 2022.
Special Features
A Gauging the interplay between market liquidity and funding liquidity
The ability of market participants to access funding and conduct transactions in an efficient way is a prerequisite for financial stability, providing shock-absorption capacity and, in turn, limiting the scope for shock amplification. Market liquidity and funding liquidity are inherently connected. When market liquidity evaporates, financial market pricing becomes less reliable and tends to overreact, leading to increased market volatility and higher funding costs. Funding liquidity enables market participants to take exposures onto their balance sheets, thus absorbing fluctuations in demand and supply in the name of efficient market functioning. Under extreme conditions, markets can stop functioning altogether. While liquidity has many dimensions, from a systemic perspective the interplay between market liquidity and funding liquidity[71] is key, as these two dimensions can reinforce each other in ways that generate liquidity spirals. Cyclical factors such as the business cycle, systemic leverage, as well as monetary and fiscal policy affect the probability of liquidity stress arising. In the light of the current challenges of high financial market volatility, increased risk of recession, bouts of heightened risk aversion and monetary policy normalisation, this special feature constructs composite indicators for market liquidity and funding liquidity. It also attempts to identify what can cause poor market liquidity and funding liquidity conditions and to show how the two dimensions interact in the euro area.
MoreB Key linkages between banks and the non-bank financial sector
Banks are connected to non-bank financial intermediation (NBFI) sector entities via loans, securities and derivatives exposures, as well as funding dependencies. Linkages with the NBFI sector expose banks to liquidity, market and credit risks. Funding from NBFI entities would appear to be the most likely and strongest spillover channel, given that NBFI entities maintain their liquidity buffers primarily as deposits and very short-term repo transactions with banks. At the same time, direct credit exposures are smaller and are often related to NBFI entities associated with banking groups. Links with NBFI entities are highly concentrated in a small group of systemically important banks, whose sizeable capital and liquidity buffers are essential to mitigate spillover risks.
MoreC Climate change and sovereign risk
Climate change can have a negative effect on sovereign balance sheets directly (when contingent liabilities materialise) and indirectly (when it has an impact on the real economy and the financial system). Part of this risk is embedded in the analyses of the macroeconomic costs of climate change which show that transition and physical risks can significantly reduce GDP growth and fiscal buffers. This special feature highlights the contingent sovereign risks that stem from an untimely or disorderly transition to a net-zero economy and from more frequent and severe natural catastrophes. It also looks at the positive role that governments can play in reducing climate-related financial risks and incentivising adaptation. If the recent trend of ever-lower emissions across the EU is to be sustained, further public sector investment is essential. In this context, the progress made to strengthen green capital markets has fostered government issuance of green and sustainable bonds to finance the transition. While putting significant resources into adaptation projects can increase countries’ resilience to climate change, the economic costs of extreme climate-related events are still set to rise materially in the EU. Only a quarter of disaster losses are currently insured and fiscal support has mitigated related macroeconomic and financial stability risks in the past. Looking ahead, vulnerabilities arising from contingent liabilities may increase in countries with high physical risk and a large insurance protection gap. If these risks rise alongside sovereign debt sustainability concerns, the impact on financial stability could be amplified by feedback loops that see sovereign credit conditions and ratings deteriorate.
MoreAcknowledgements
The Financial Stability Review assesses the sources of risks to and vulnerabilities in the euro area financial system based on regular surveillance activities, analysis and findings from discussions with market participants and academic researchers.
The preparation of the Review was coordinated by the ECB’s Directorate General Macroprudential Policy and Financial Stability. The Review has benefited from input, comments and suggestions from other business areas across the ECB. Comments from members of the ESCB Financial Stability Committee are gratefully acknowledged.
The Review was endorsed by the ECB’s Governing Council on 24 May 2023.
Its contents were prepared by Pablo Anaya Longaric, Pierce Daly, Nander de Vette, John Fell, Sándor Gardó, Paul Hiebert, Benjamin Klaus, Csaba Móré, Mara Pirovano, Tamarah Shakir, Andrzej Sowiński, Manuela Storz, Christian Weistroffer and Jonas Wendelborn.
With additional contributions from Markus Behn, Marcus Bierich, Alexandra Born, Lorenzo Cappiello, Joachim Eule, Michael Grill, Maciej Grodzicki, Lieven Hermans, Paulina Jacobsen, Benedikt Kagerer, Sujit Kapadia, Kateryna Koroliuk, Georgi Krustev, Claudia Lambert, Ana Lima, Peter McQuade, Baptiste Meunier, Charles O’Donnell, Cristian Perales, Allegra Pietsch, Ellen Ryan, Beatrice Scheubel, Pablo Serrano Ascandoni, Elisa Telesca, Mika Tujula, Stamatis Vasilakos, Andrea Vismara and Balázs Zsámboki.
Editorial, multimedia and production assistance was provided by Lena-Sophie Demuth, Anna Heckler, Peter Nicholson, Katie Ranger, Sophia Suh and Daniel Weber.
© European Central Bank, 2023
Postal address 60640 Frankfurt am Main, Germany
Telephone +49 69 1344 0
Website www.ecb.europa.eu
All rights reserved. Reproduction for educational and non-commercial purposes is permitted provided that the source is acknowledged.
For specific terminology please refer to the ECB glossary (available in English only).
PDF ISSN 1830-2025, QB-XU-23-001-EN-N
HTML ISSN 1830-2025, QB-XU-23-001-EN-Q
See the box entitled “Spillovers to the euro area in a scenario of a stronger rebound in China’s economy”, ECB staff macroeconomic projections for the euro area, ECB, March 2023.
Standard & Poor’s downgraded US debt by one notch from AAA to AA+ with a negative outlook after the debt ceiling was reached in 2011.
See the box entitled “Spillovers to the euro area in a scenario of a stronger rebound in China’s economy”, ECB staff macroeconomic projections for the euro area, ECB, March 2023.
See “What shapes spillovers from US monetary policy shocks to emerging market economies?”, Economic Bulletin, Issue 2, ECB, March 2023.
See March 2023 ECB staff macroeconomic projections for the euro area.
It is estimated that about 12% of the total support targets vulnerable households and, to a smaller extent, firms directly affected by the hike in energy prices; see the article entitled “Fiscal policy and high inflation”, Economic Bulletin, Issue 2, ECB, 2023.
See the article entitled “Fiscal policy and high inflation”, ibid.
See the box entitled “Sensitivity of sovereign debt in the euro area to an interest rate-growth differential shock”, Financial Stability Review, ECB, November 2021.
See the article entitled “Fiscal policy and high inflation”, op. cit.
See “Quantitative tightening: rationale and market impact”, speech by Isabel Schnabel, Frankfurt am Main, 2 March 2023.
Gross financing needs – a measure of government liquidity risk – are expected to decline from 18.5% in 2022 to 18.4% of GDP in 2023 but to remain above the 16% signalling threshold as defined by the European Commission. See “Debt Sustainability Monitor 2022”, Institutional Paper 199, European Commission, 14 April 2023.
Proxied by the change in the gross value-added deflator that is not explained by the change in compensation paid to employees.
The increasing reliance on fixed-rate loans compared with the previous hiking cycle is currently mitigating some of the increase in interest rates in some euro area countries.
A sizeable pickup in Spanish bankruptcies is an exception, driven largely by sole proprietors, the removal of the bankruptcy moratorium in June 2022 and the amended Spanish Bankruptcy Law which entered into force on 26 September 2022.
The Altman Z-score captures insolvency risk based on five balance sheet and income statement ratios, together with their joint importance. See Altman, E.I. (1968), “Financial ratios, discriminant analysis and the prediction of corporate bankruptcy”, The Journal of Finance, Vol. 23, No 4, pp. 589-609.
See also the special feature entitled “Household inequality and financial stability risks: exploring the impact of changes in consumer prices and interest rates”, Financial Stability Review, ECB, November 2022.
While this holds for the euro area as a whole, there are differences across euro area countries, with some countries showing positive developments in 2022.
See also “The growing role of investment funds in euro area real estate markets: risks and policy considerations”, Macroprudential Bulletin, Issue 20, ECB, April 2023, and “Vulnerabilities in the EEA commercial real estate sector”, ESRB, January 2023.
Such effects may vary across euro area countries depending on the relevance of the CRE sector in their economy.
See the box entitled “Explaining cross-border transactions in euro area commercial real estate markets”, Financial Stability Review, ECB, November 2019; Giuzio, M., Kaufmann, C., Ryan, E. and Cappiello, L., “Investment funds, risk-taking, and monetary policy in the euro area”, Working Paper Series, No 2605, ECB, October 2021; “The rise of non-bank financial intermediation in real estate finance: Post-COVID-19 trends, vulnerabilities and policy implications”, OECD, 2021; Schnabel, I., “Monetary policy and inequality”, speech at a virtual conference on “Diversity and Inclusion in Economics, Finance, and Central Banking”, 9 November 2021.
Amplification effects particularly depend on the prevalence of open-ended real estate funds, which varies across countries.
See the box entitled “Spillovers to the euro area in a scenario of a stronger rebound in China’s economy”, ECB staff macroeconomic projections for the euro area, March 2023.
See also the special feature entitled “Financial stability risks from energy derivatives markets”, Financial Stability Review, ECB, November 2022.
For a literature review covering the link between yield curve inversion and recessions, see, for example, Benzoni, L., Chyruk, O. and Kelley, D., “Why Does the Yield-Curve Slope Predict Recessions?”, Chicago Fed Letter, No 404, Federal Reserve Bank of Chicago, 2018.
See the box entitled “Cross-asset correlations in a more inflationary environment and challenges for diversification strategies”, Financial Stability Review, ECB, November 2022.
In the March 2023 Bank of America Global Fund Manager Survey, “systemic credit event” overtook “inflation staying high” as the key tail risk indicated by respondents.
See the box entitled “Understanding what happens when ‘angels fall’”, Financial Stability Review, ECB, November 2020.
See the box entitled “Potential Spillover Effects of Changes to Japan’s Yield Curve Control Policy’’, Global Financial Stability Report, International Monetary Fund, 11 April 2023.
See also Statement on Monetary Policy, Bank of Japan, 20 December 2022.
By contrast, some portfolio investments by Japanese investors might be driven primarily by credit risk premia, term premia or their willingness to speculate on changes in interest rate expectations. In such cases investors often hedge the foreign exchange risk, hence also losing the benefits of a positive risk-free rate differential.
Higher prices of CDS contracts might be driven by the discount in market prices of cheapest-to-deliver bonds and therefore do not necessarily imply higher probability of default.
See the box entitled “The Fast-Growing Interest in Retails’ Trading in the Zero-Day Options Market: Is It a Hidden Risk?’’, Global Financial Stability Report, International Monetary Fund, 11 April 2023.
This box focuses mainly on deposits from households and non-financial corporations, which account for around 71% of the total deposits and 54% of the total liabilities of euro area banks (source ECB MFI Interest Rate Statistics).
This figure differs from the headline ROE reported in the ECB’s supervisory banking statistics for at least two reasons. First, in this chapter net income is annualised using trailing four-quarter sums as opposed to the annualised year-to-date net income. Second, ROE is calculated for a balanced sample of 83 euro area significant institutions in contrast to the full (unbalanced) sample of significant institutions covered in the supervisory banking statistics.
See the special feature entitled “Euro area bank profitability: where can consolidation help?”, Financial Stability Review, ECB, November 2019.
See the special feature entitled “Towards a framework for assessing systemic cyber risk”, Financial Stability Review, ECB, November 2022.
See the special feature entitled “Household inequality and financial stability risks: exploring the impact of changes in consumer prices and interest rates”, Financial Stability Review, ECB, November 2022.
See, for example, “Financial stability implications of IFRS 9”, European Systemic Risk Board, July 2017, or “The procyclicality of loan loss provisions: a literature review”, Working Paper Series, No 39, Basel Committee on Banking Supervision, Bank for International Settlements, 2021.
Loans are sorted into stages, where Stage 1 comprises performing loans, Stage 2 underperforming loans that have seen a significant increase in credit risk and Stage 3 credit-impaired loans (see, for example, “Snapshot: Financial Instruments: Expected Credit Losses”, IASB, 2013).
For trends in the external sources of funding of euro area firms, see “Non-bank financial intermediation in the euro area: implications for monetary policy transmission and key vulnerabilities”, Occasional Paper Series, No 270, ECB, 2021, and the article entitled “Firm debt financing structures and the transmission of shocks in the euro area”, Economic Bulletin, Issue 4, ECB, 2022.
For further discussion of property funds, see the article entitled “The growing role of investment funds in euro area real estate markets: risks and policy considerations”, Macroprudential Bulletin, ECB, April 2023.
See also “The growing role of investment funds in euro area real estate markets: risks and policy considerations”, Macroprudential Bulletin, Issue 20, ECB, April 2023.
Between January 2014 and May 2020, the average cash buffers of bond and equity funds combined was 2.8% of total assets. Within this, bond funds had an average cash buffer of 3.4% while equity funds had an average cash buffer of 2.2% of their total assets. In December 2022, the combined cash buffer for both types of fund was 2.3% of total assets, and 2.8% and 1.9% for bond and equity funds respectively. ECB calculations are based on EPFR Global data.
See the box entitled “Investment funds’ procyclical selling and cash hoarding: a case for strengthening regulation from a macroprudential perspective”, Financial Stability Review, ECB, May 2021.
A policy lapse occurs when a policyholder stops paying the policy premium, in which case the benefits and coverage provided under the policy are terminated.
Claims inflation refers to the increase in the cost of claims payments, which may be higher than the increase in the consumer price index which often serves as a base for indexed contracts.
Unit-linked policies offer both an insurance component and an investment component. Part of the premiums paid by policyholders goes towards life insurance cover, with the remainder pooled and invested (e.g. in equities, bonds or real estate). Unlike traditional insurance products, unit-linked policyholders bear the investment risk (i.e. gains or losses on investment exposure).
Five euro area countries have now adopted a framework that foresees a positive neutral rate for the CCyB (Estonia, Ireland, Cyprus, Lithuania and the Netherlands). See the article entitled “A positive neutral rate for the countercyclical capital buffer – state of play in the banking union”, Macroprudential Bulletin, Issue 21, ECB, April 2023.
The weighted average is calculated including the countries in which the CCyB rate is 0%.
To find out more about the complementarity of capital and borrower-based measures, see the article entitled “The transmission and effectiveness of macroprudential policies for residential real estate”, Macroprudential Bulletin, Issue 19, ECB, 2022. For an overview of currently implemented borrower-based measures, see the ESRB’s website.
In 2022 the ECB published its opinions on the European Commission’s proposed amendments to the Capital Requirements Directive (CRD VI) and the Capital Requirements Regulation (CRR III). The ECB has also published two blog posts (entitled “Mind the gap, close the gap – the ECB’s view on the banking package reforms” and “Strong rules, strong banks: let’s stick to our commitments”) on its concerns over proposed deviations from international standards.
See “Reform of bank crisis management and deposit insurance framework”, European Commission, 18 April 2023.
For an acknowledgement of this limitation in the current framework, see the Eurogroup press release, 4 December 2018.
See the statement by the Swiss Financial Market Authority (FINMA), 19 March 2023.
FINMA, based on the contractual agreements and the Emergency Ordinance, instructed Credit Suisse to write down the AT1 bonds following the extraordinary public support provided by the Swiss authorities; see FINMA’s statement of 23 March 2023.
See “ECB Banking Supervision, SRB and EBA statement on the announcement on 19 March 2023 by Swiss authorities”, press release, 20 March 2023.
See “Enhancing the Resilience of Non-Bank Financial Intermediation – Progress report”, FSB, November 2022.
At the international level, see “Policy Proposals to Enhance Money Market Fund Resilience – Final report”, FSB, October 2021. At the European level, see “Eurosystem contribution to the European Securities and Markets Authority (ESMA) consultation on the framework for EU money market funds”, ECB, June 2021, “Recommendation of the European Systemic Risk Board of 2 December 2021 on reform of money market funds”, ESRB, January 2022, and “ESMA opinion on the review of the Money Market Fund Regulation”, ESMA, February 2022.
See “Assessment of the Effectiveness of the FSB’s 2017 Recommendations on Liquidity Mismatch in Open-Ended Funds”, FSB, December 2022.
For a more detailed discussion, see the article entitled “The growing role of investment funds in euro area real estate markets: risks and policy considerations”, Macroprudential Bulletin, ECB, April 2023.
See report and guidelines on “Liquidity stress testing in German asset management companies”, BaFin, April 2018.
See “The Central Bank’s macroprudential policy framework for Irish property funds”, Central Bank of Ireland, November 2022.
Such tools aim to impose the cost of redemptions on redeeming investors, thereby preventing the remaining investors from having to bear the cost. This can be achieved, for example, by adjusting the price at which investors buy and sell shares in the fund or by imposing a redemption fee.
A cap means that the additional levy or NAV adjustment cannot exceed a certain percentage.
The prudential framework for investment funds in the EU stipulates that the liquidity profile of investments must be in line with the redemption policy for funds under the UCITS Directive. For alternative investment funds asset managers should ensure consistency between a fund’s liquidity profile and its redemption policy.
See BCBS, CPMI, IOSCO, “Review of margining practices”, Bank for International Settlements, September 2022. At the European level, ESMA is consulting on central counterparty anti-procyclicality measures (see “Review of RTS No 153/2013 with respect to procyclicality of margin”, Consultation Paper, ESMA, 27 January 2022).
See “Capital markets union: clearing, insolvency and listing package”, European Commission, 7 December 2022.
A Tier 2 CCP is a systemically important CCP based in a non-EU country, a status which allows for supervision by ESMA.
This will target market participants subject to the EMIR clearing requirement for derivatives identified by ESMA as being systemically important. These include interest rate derivatives (EUR, PLN), credit default swaps (EUR) and short-term interest rate derivatives (EUR).
See “Guidelines on Article 25 of Directive 2011/61/EU”, ESMA, 23 June 2021.
Throughout this special feature, funding liquidity refers to funding liquidity for banks.
This special feature has benefited from input from Tina Emambakhsh, Riccardo Pizzeghello and Elisa Telesca.
-
31 May 2023