Comparing recent inflation developments in the United States and the euro area
Published as part of the ECB Economic Bulletin, Issue 6/2021.
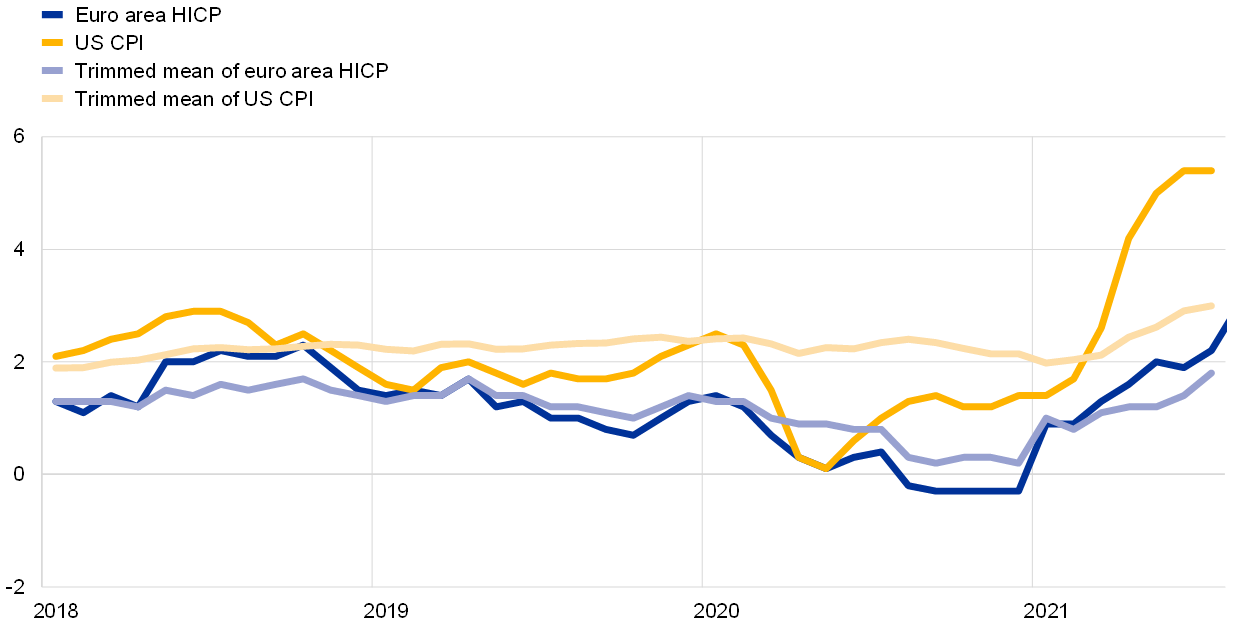
After having declined in 2020, headline inflation has increased strongly in both the United States and the euro area over recent months (Chart A). Base effects related to the recovery of energy prices from last year’s fall have played an important role in this increase ‒ both in the United States and the euro area.[1]
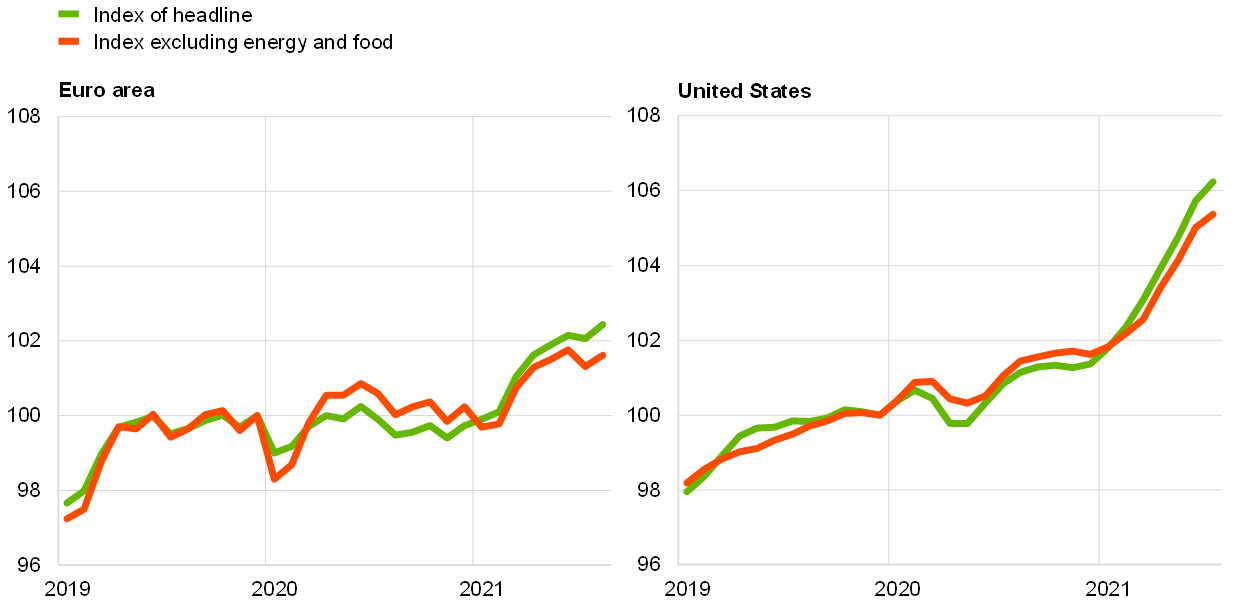
However, the recent increase in headline inflation has been substantially more pronounced in the United States than in the euro area, which is also reflected in development of price levels in the United States and in the euro area. The indices for headline inflation and inflation excluding energy and food stand in the euro area just around 2% higher than before the coronavirus (COVID-19) pandemic (December 2019), while in the United States they stand around 6% higher (Chart B).
Developments in headline inflation over recent months have, especially in the United States, been driven by a relatively small number of items with very high inflation rates – including energy prices. This can be illustrated, for example, by the “trimmed means” of US CPI and euro area HICP inflation, which exclude the items with the highest and the lowest inflation rates (Chart A). Trimmed mean headline inflation increased from January to July 2021 by around 1.0 percentage points for the US CPI and 0.8 percentage points for euro area HICP. By contrast, untrimmed US headline CPI inflation increased by 4.0 percentage points over that period, while in the euro area HICP inflation rose by 1.3 percentage points.
Chart A
Headline inflation and trimmed means
(annual percentage changes)
Sources: Eurostat, Federal Reserve Bank of Cleveland and ECB.
Notes: HICP stands for Harmonised Index of Consumer Prices and CPI for Consumer Price Index. The trimmed mean excludes 16% of items for the US CPI (calculation by the Federal Reserve Bank of Cleveland) and 15% of items for the euro area HICP (based on ECB calculations). The trimmed means remove around 8% from each tail of the distribution of price changes in the euro area HICP and the US CPI each month. The annual rates of change are calculated using rescaled weights. The latest observations are for July 2021, except for euro area HICP, for which the latest observation is for August 2021.
Chart B
Index levels for HICP in the euro area and CPI in the United States
(index: December 2019 = 100)
Sources: Eurostat, Federal Reserve Bank of Cleveland and ECB.
Notes: HICP stands for Harmonised Index of Consumer Prices and CPI for Consumer Price Index. Inflation excluding energy and food refers to the HICP excluding energy and food for the euro area and CPI less food and energy for the United States.The latest observations are for July 2021 for the United States and August 2021 for the euro area.
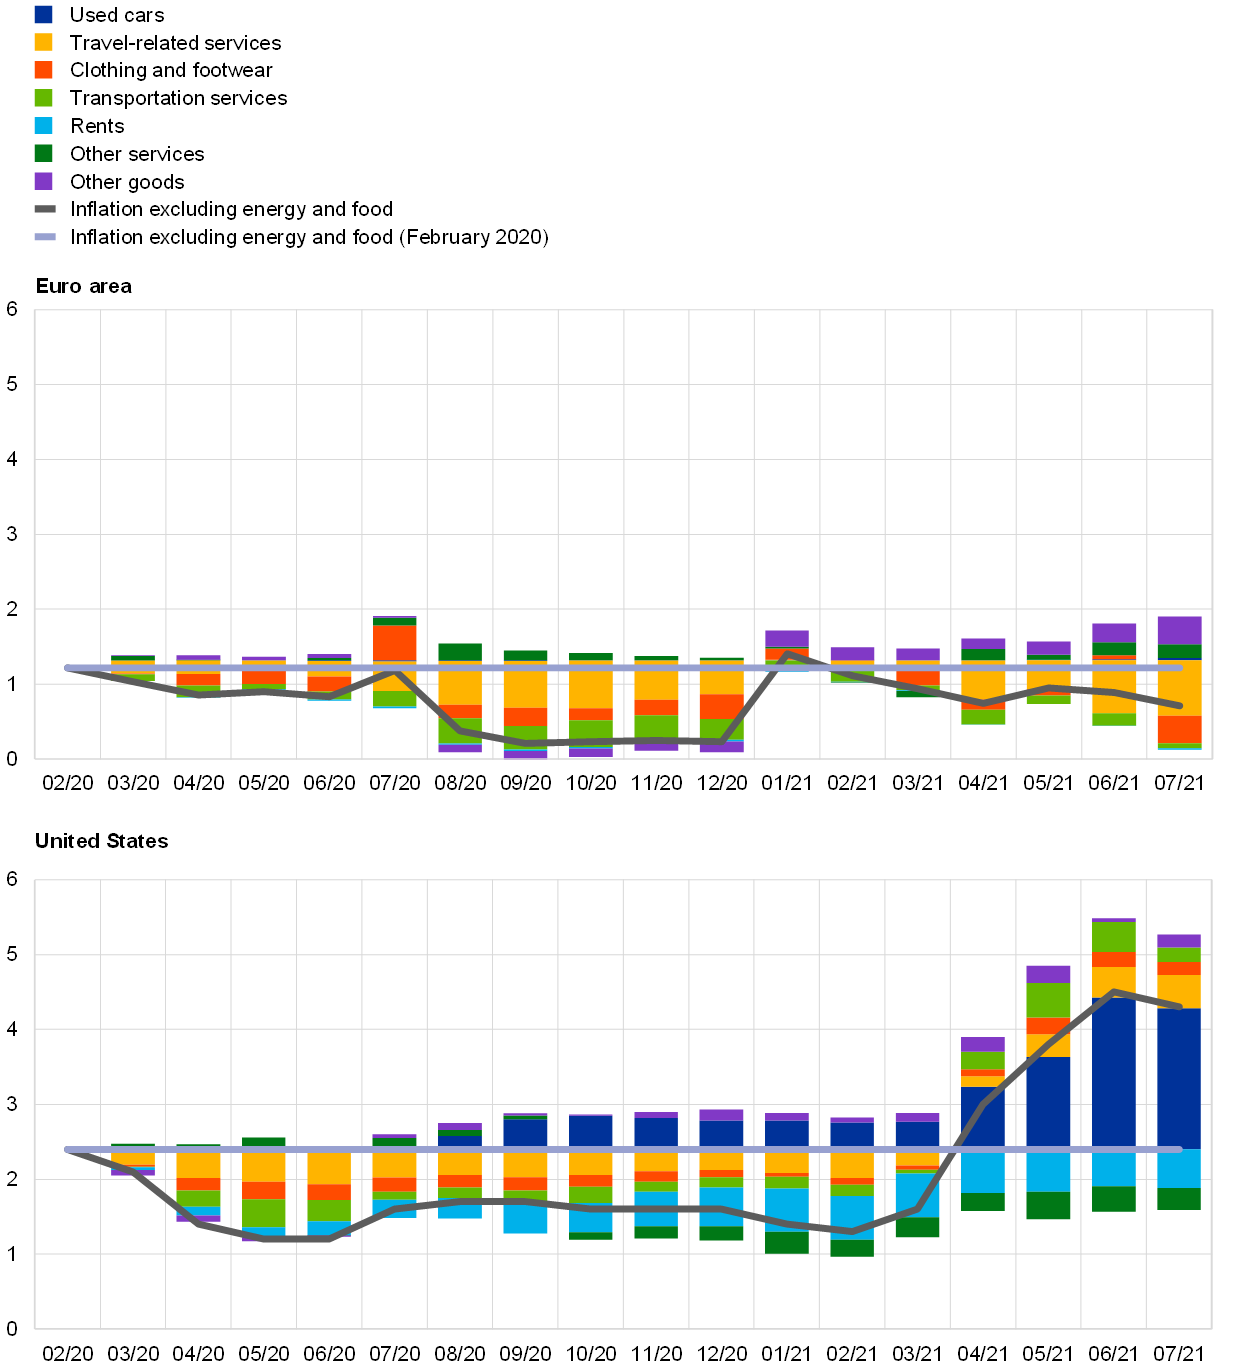
While in the United States CPI inflation less food and energy is now significantly higher than before the pandemic, in the euro area HICP inflation excluding energy and food (HICPX) has remained lower than before the pandemic (Chart C).[2] In the euro area, HICPX inflation stood at 0.7% in July 2021, compared with 1.2% in February 2020. In contrast, CPI inflation less food and energy in the United States started from a substantially higher level (2.4% in February 2020) and stood at 4.3% in July 2021. In addition to the still larger amount of slack in the euro area, these differences in inflation developments can be attributed to several factors. First, US prices for used cars and trucks soared during the second quarter of 2021 for a number of reasons: new cars, a close substitute, were less available because of a slowdown in production stemming from semiconductor shortages, rental car companies reduced sales of their used cars amid stronger demand for car rentals as the economy re-opened, preferences shifted away from public to private transport, and household disposable income was boosted by fiscal stimuli – pushing up demand for used cars in the United States. The rise in prices for used cars and trucks alone represented, at 1.5 percentage points, around half the increase in US CPI inflation less food and energy from 1.4% in January 2021 to 4.3% in July 2021. In the euro area, by contrast, there has been some increase in prices for new cars in recent months – partly linked to supply chain bottlenecks – but prices for used cars did not on average rise very markedly in the absence of very strong increases in demand. Furthermore, the weight of used cars in headline HICP is considerably smaller (1.1% compared with around 3% in the United States). Second, US prices for travel-related and transportation services rose strongly following the easing of containment measures, which has led to a substantial positive contribution to CPI inflation over the last few months. In the euro area, containment measures were lifted later, and thus the response of transportation and travel-related services has lagged behind that in the United States.[3] Rents have slightly moderated the divergence between inflation developments in the United States and the euro area. Whereas they have been a drag on inflation less food and energy in the United States, this has not been the case in the euro area, reflecting a larger weight in the US consumption basket and stickier euro area rents during the pandemic. There are, however, some common features in the US and euro area core inflation developments. Both exhibited an increasing contribution from consumer goods excluding volatile items such as clothing and footwear and used cars (Chart D). This likely reflects a combination of factors, such as the recovery of demand after lockdowns, but also some pass-through of global pipeline pressures triggered by higher input prices (including for commodities), shipping costs and bottlenecks for some inputs.[4]
Chart C
Contributions to inflation excluding energy and food in the euro area and the United States
(annual percentage changes; percentage point contributions compared with February 2020)
Sources: Haver Analytics, Eurostat and ECB staff calculations.
Notes: HICP stands for Harmonised Index of Consumer Prices and CPI for Consumer Price Index. Contributions to HICP excluding energy and food for the euro area and CPI less food and energy for the United States. Euro area developments were affected by the temporary VAT cut in Germany in the second half of 2020. Airline fares are included in travel-related services for both the euro area and the United States and excluded from transport services. The latest observations are for July 2021.
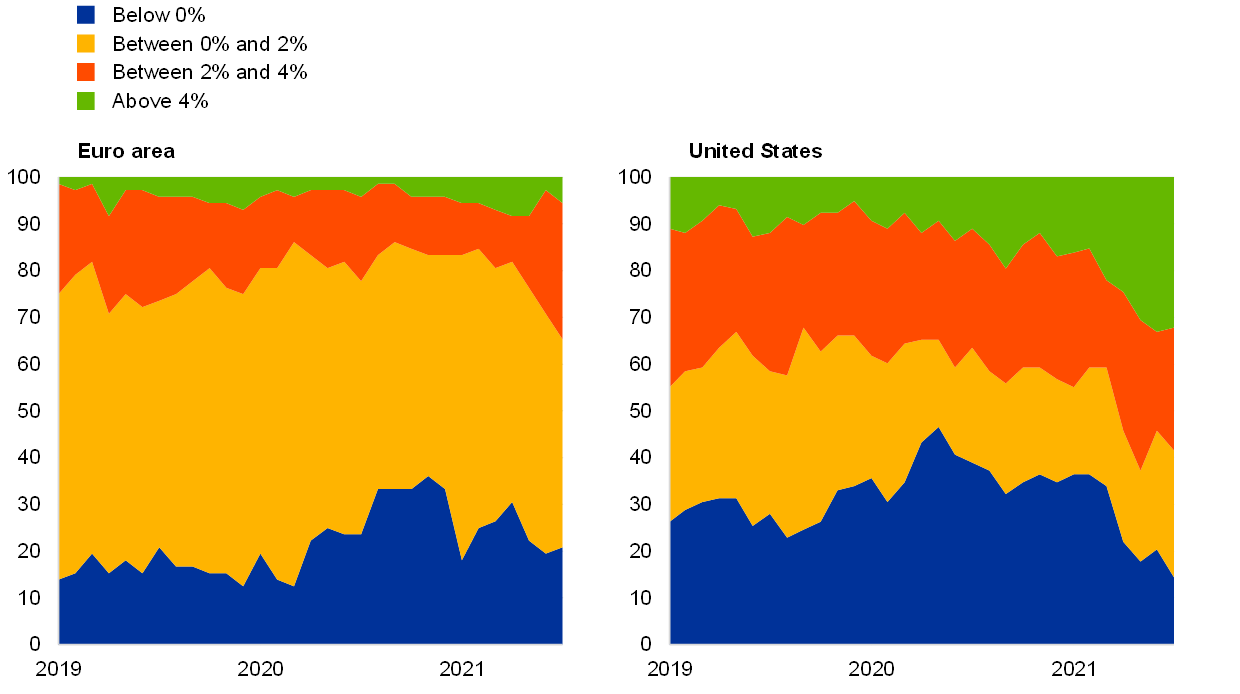
Price pressures are more broad-based in the United States than in the euro area (Chart D). While a few items with especially high inflation rates (including energy inflation) played a crucial role in the strong increase in headline inflation over recent months, price pressures in the United States have increased more broadly across the distribution of items included in CPI less food and energy. Zooming in on the distributions of price changes for items included in this index in the United States, the share of items with annual price increases above 4% has increased sharply (to approximately one-third in July 2021), while at the same time the share of items with negative inflation rates has decreased substantially (from around one-third in January to 14% in July). In the euro area, by contrast, the shares of items with very low inflation (below zero) and high inflation (above 4%) have remained relatively stable. The share of items with inflation rates between 2% and 4% increased from around 10% at the beginning of the year to around 30% in July, while the share of items with inflation rates between 0% and 2% decreased by a similar amount but remained the dominant category in the euro area. As a result the share of items in the US core inflation basket with inflation rates above 2% ‒ which can be seen as an indicator for the broadness of price pressures ‒ has increased recently to close to two-thirds from less than half in the year before the pandemic. In the euro area, this share has been much lower and has only very recently increased to around one-third (in July).
Chart D
Distribution of inflation rates across items included in inflation excluding energy and food
(share of items by inflation rate in euro area HICPX and US CPI less food and energy; percentages)
Sources: Haver Analytics, Eurostat and ECB calculations.
Notes: HICP stands for Harmonised Index of Consumer Prices and CPI for Consumer Price Index. HICP excluding energy and food for the euro area and CPI less food and energy for the United States. The shares are computed as a unit count of the components of US core CPI and euro area HICPX inflation. For the euro area 72 items are included, for the United States 118 items are included. The latest observations are for July 2021.
Recent increases in inflation have pushed up the inflation expectations of professional forecasters (Chart E). Compared with the beginning of the year, inflation expectations for 2021 have been revised upwards for the euro area and even more so for the United States (1.2 percentage points for the euro area and 2.0 percentage points for the United States – Chart E, panel a). For 2022 the upward revision has been substantial for the United States but only moderate for the euro area (0.7 percentage points for the United States and 0.3 percentage points for the euro area). In the latest survey by Consensus Economics (August 2021), mean forecasts see US headline CPI inflation reaching 4.1% in 2021 before falling back to 2.9% in 2022. For the euro area, headline inflation is expected to rise to 2.1% in 2021 before falling back to 1.5% in 2022 – a path comparable to that projected in the September ECB staff macroeconomic projections. According to Consensus Economics, while US headline inflation is expected overall to stand quite substantially above pre-crisis levels in 2022, euro area inflation is expected to fall back in 2022 to levels that are only somewhat above those recorded in 2019. At the same time, judging from the range of projections included in the Consensus Economics forecasts, uncertainty about inflation developments in 2022 seems to remain substantially higher in the United States than in the euro area.
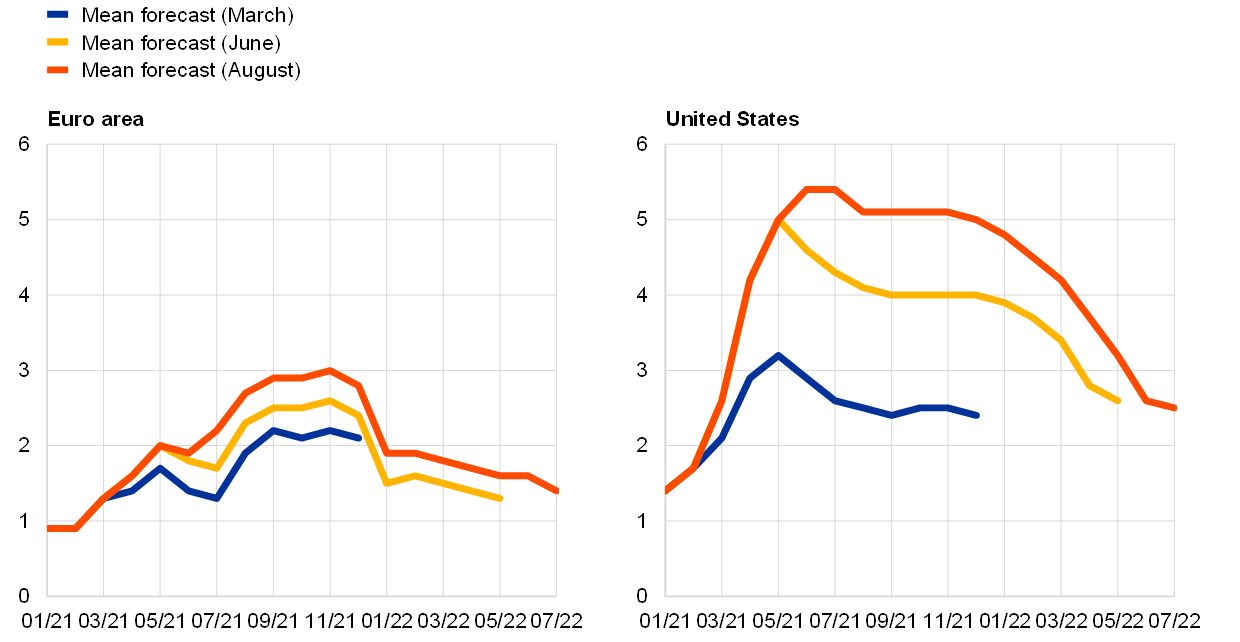
Upside surprises in inflation data releases over recent months have been substantially stronger for the United States than for the euro area. Developments in Consensus Economics forecasts at a monthly frequency (Chart E, panel b – starting with forecasts from March 2021) show that inflation developments have been higher than forecast in recent months in the euro area and even more so in the United States. Looking ahead, Consensus Economics forecasts see headline inflation remaining elevated over the coming months, but falling to 2.5% in the United States and to 1.4% in the euro area by July 2022 – bringing inflation back to the levels observed in spring 2021 before the recent strong increases in inflation rates in both regions.
Chart E
Inflation expectations from Consensus Economics for US headline CPI and euro area headline HICP inflation
a) Annual inflation forecasts
(annual percentage changes)

b) Monthly inflation forecasts
(annual percentage changes)
Sources: Consensus Economics, Eurostat, Haver Analytics and ECB calculations.
Notes: Grey areas reflect the ranges of forecasts included in Consensus Economics surveys. Monthly forecasts from March 2021 are available up to December 2021 only; the August forecast vintage includes forecasts up to July 2022.
Overall, a substantial part of the strong increases in inflation and the upside inflation surprises over recent months in the United States and the euro area can be attributed to special factors that are likely to be of a temporary nature. For a more permanent increase in inflation, price pressures would usually need to become more broad-based (especially in the euro area) and also reflect increasing labour cost pressures. However, there is so far no firm indication of the latter once the effects of changes in the composition of employment and of job retention schemes are taken into account. At the same time, the recovery from the pandemic represents a unique situation with considerable irregularities for inflation developments, which require close monitoring and add to the uncertainty surrounding the inflation outlook.
- See also the box entitled “Recent dynamics in energy inflation: the role of base effects and taxes”, Economic Bulletin, Issue 3, ECB, 2021.
- Changes to HICP weights in 2021 have also affected developments in HICPX inflation in the euro area since the start of 2021. These have had a negative impact on the most recent developments in HICPX inflation – taking into account these effects would bring HICPX inflation in the euro area much closer to the level recorded in February 2020. For details see Section 4 and especially Chart 8 of Economic Bulletin, Issue 5, ECB, 2021.
- Additionally, changes in 2021 HICP weights have had a negative effect on inflation rates especially in these services (see previous footnote).
- See also the boxes entitled “What is driving the recent surge in shipping costs?”, Economic Bulletin, Issue 3, ECB, 2021, “The semiconductor shortage and its implication for euro area trade, production and prices”, Economic Bulletin, Issue 4, ECB, 2021 and “Recent developments in pipeline pressures for non-energy industrial goods inflation in the euro area”, Economic Bulletin, Issue 5, ECB, 2021.


